
Figure 2.
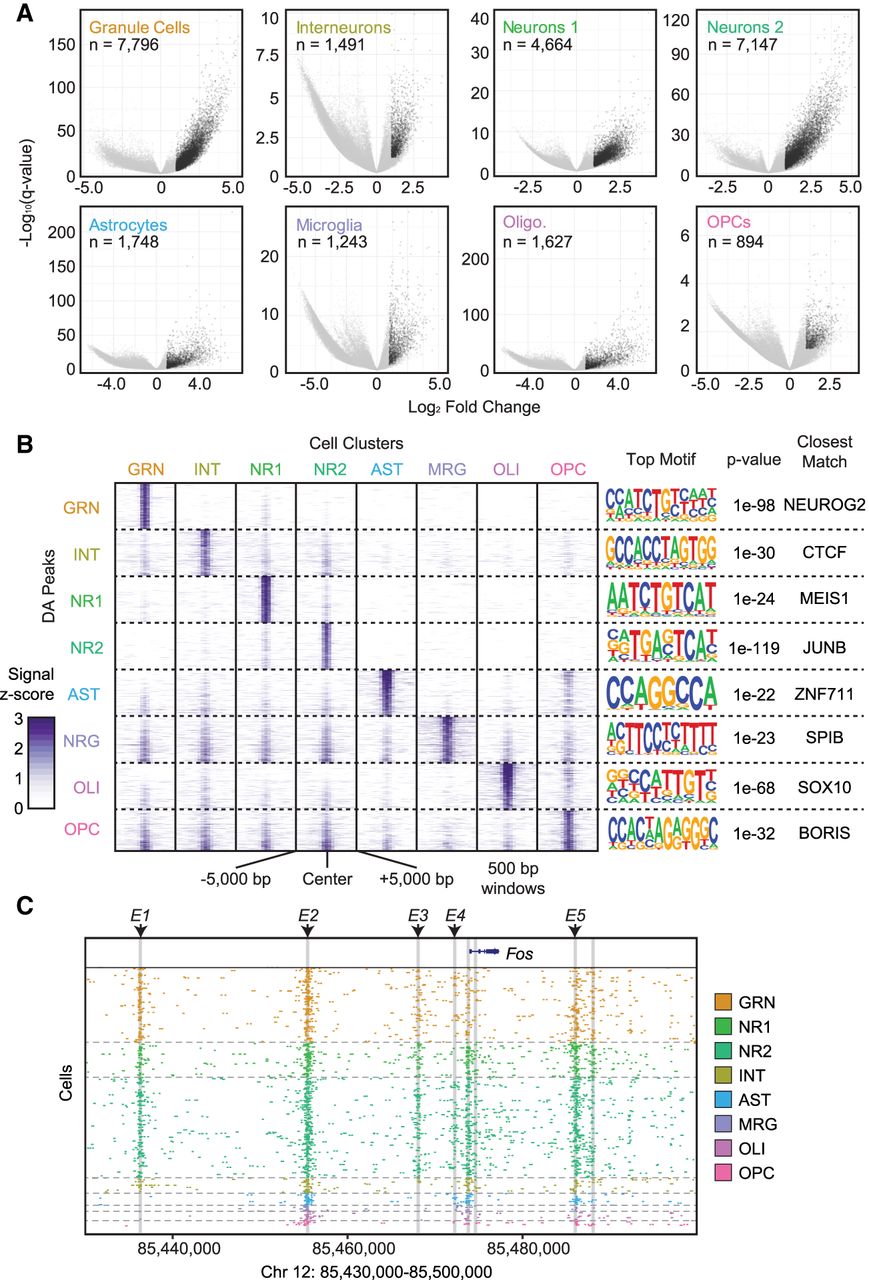
Differential accessibility analysis between cell types. (A) Volcano plots −log10(Q-value) (y-axis) versus log2 accessibility signal fold-change (x-axis) showing all peaks. Each comparison is for the indicated cell population versus all other cell types. Significant peaks (number indicated, Q-value ≤0.01, log2 fold-change ≥1) are in black. (B) ATAC-seq signal plots for the top differential accessible peaks for each cell type. The most significantly enriched motif for each set is shown on the right along with the corresponding P-value and closest-matching known motif. (C) Fos locus with enhancers E1 through E5 highlighted to show cell-type–specific utilization.


