
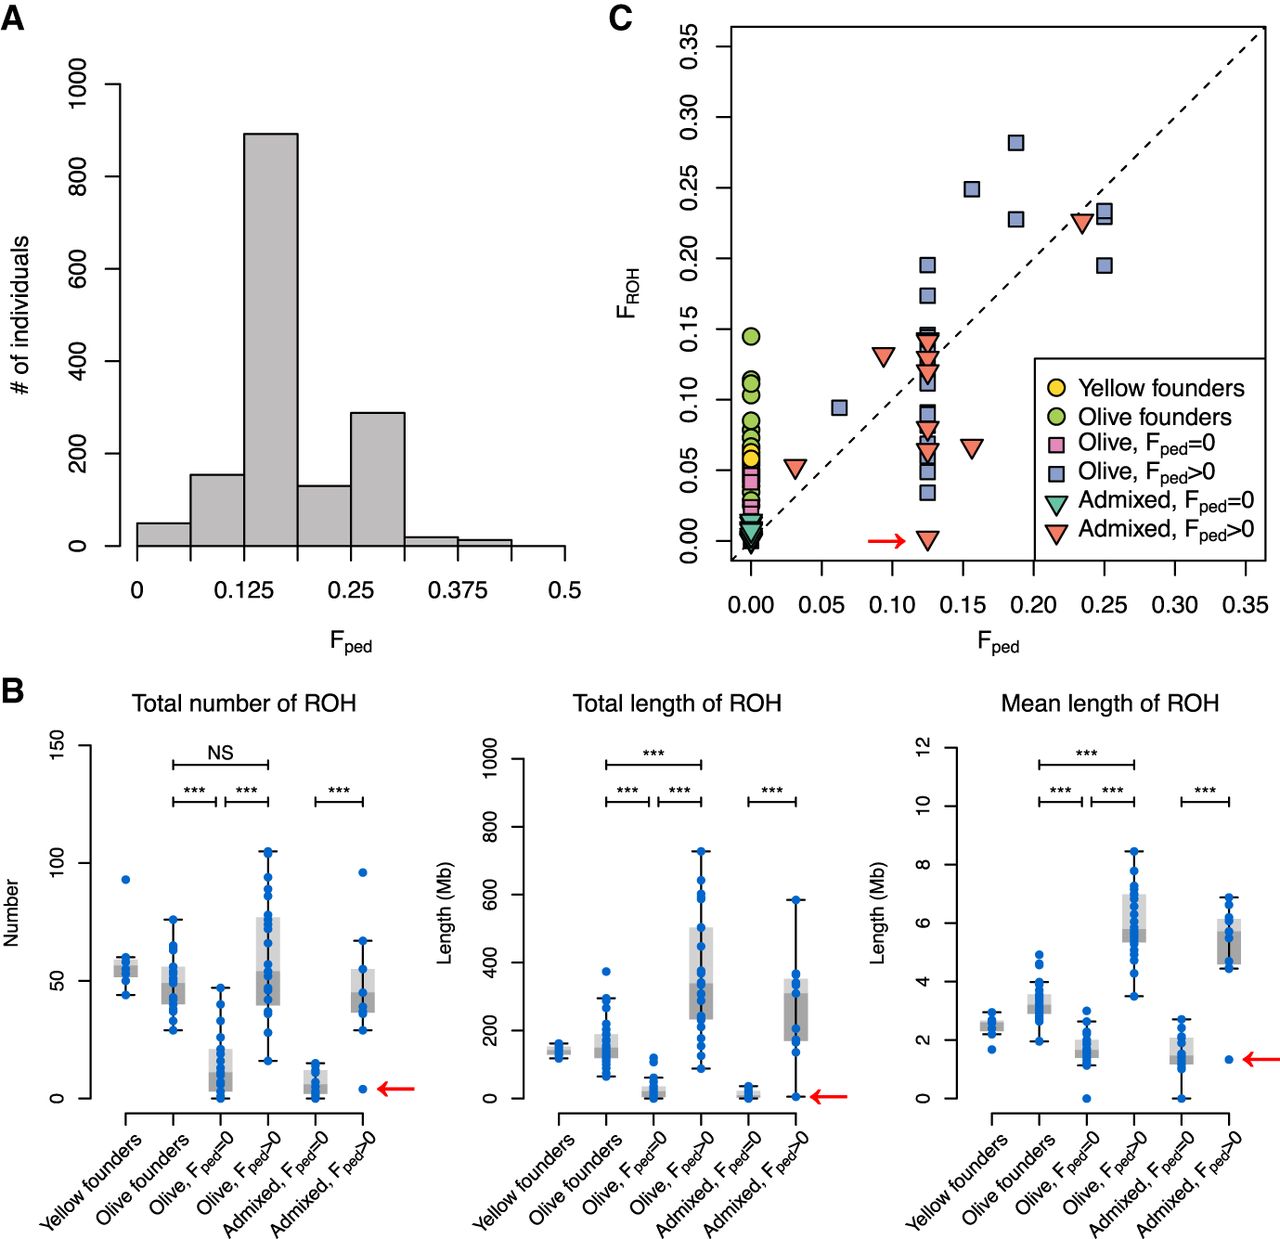
Inbreeding and ROH in the captive baboon colony. (A) Histogram showing the distribution of inbreeding coefficients in the pedigree (Fped). Individuals with Fped = 0 are not shown. (B) Inbred ancestry (Fped > 0) increases the total number, total length, and mean length of ROH in the genome, regardless of admixture status. Founder individuals also show indications of inbreeding in their ancestry. Sample sizes: yellow founders, 8; olive founders, 25; olive, Fped = 0: 18; olive, Fped > 0: 24; admixed, Fped = 0: 14; admixed, Fped > 0: 11. The putatively inbred individual that does not appear to be inbred based on lack of ROH is indicated with red arrows. (NS) Not significant below a threshold of 0.05, (***) P < 0.001. All P-values were multiplied by 4 to correct for multiple tests. (C) The proportion of the genome contained within ROH (FROH) can vary substantially from Fped. The dashed line represents the line y = x.


