
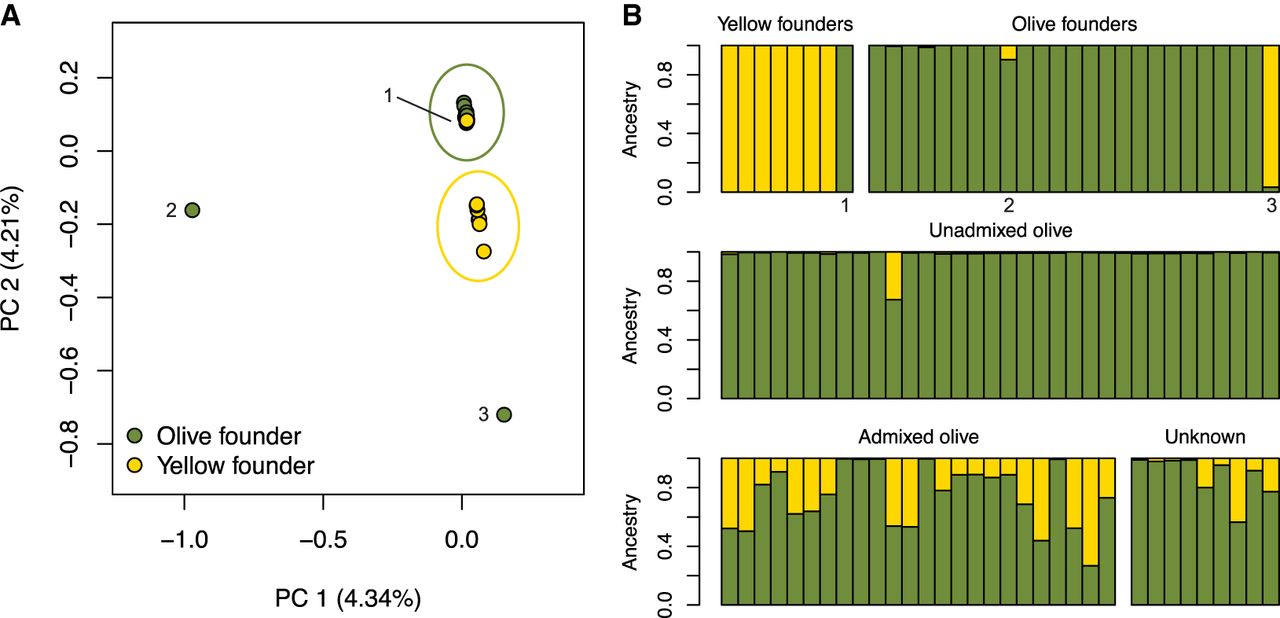
Figure 2.
Genetic ancestry patterns in baboons from the SNPRC. (A) PCA shows that olive and yellow baboon founders form distinct clusters, but one olive baboon was mislabeled as a yellow baboon (1: 1X3576), and two other individuals are extreme outliers (2: 1X0812, 3: 1X4384). (B) Similarly, ADMIXTURE results under a model of two ancestral populations (K = 2) show that patterns of olive and yellow baboon ancestry are not always concordant with given species labels. Individuals labeled as 1, 2, and 3 in the PCA are indicated. Individuals are grouped according to their classification from the colony records (see Supplemental Table S1).


