
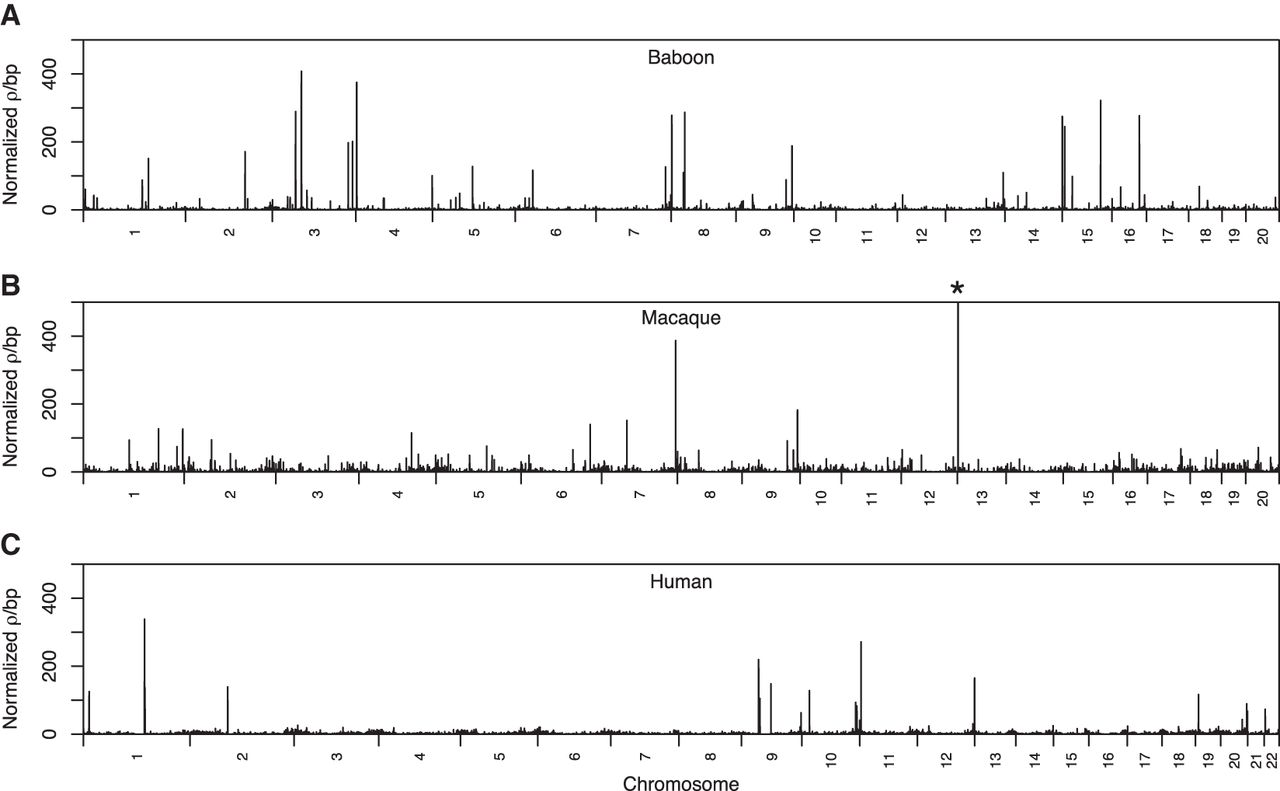
Recombination rates across the baboon, macaque, and human reference genomes. Rates were inferred from genetic variation in 24 unadmixed olive founder baboons (A), 24 Indian rhesus macaques (B), and 24 unrelated African (Yoruban) individuals (C). Rates were calculated in nonoverlapping 100-kb windows across the genome and normalized by dividing raw rates by the mean rate inferred within each data set (mean ρ/bp: baboons, 3.55 × 10⁻³; macaques, 1.79 × 10⁻³; humans: 5.87 × 10⁻³). Here, a block penalty of 5 was used. Extremely high recombination rates, evident in the large number of high peaks across the genome, highlight putative errors in the Panu_2.0 genome assembly. (*) Peak height = 963.133.


