
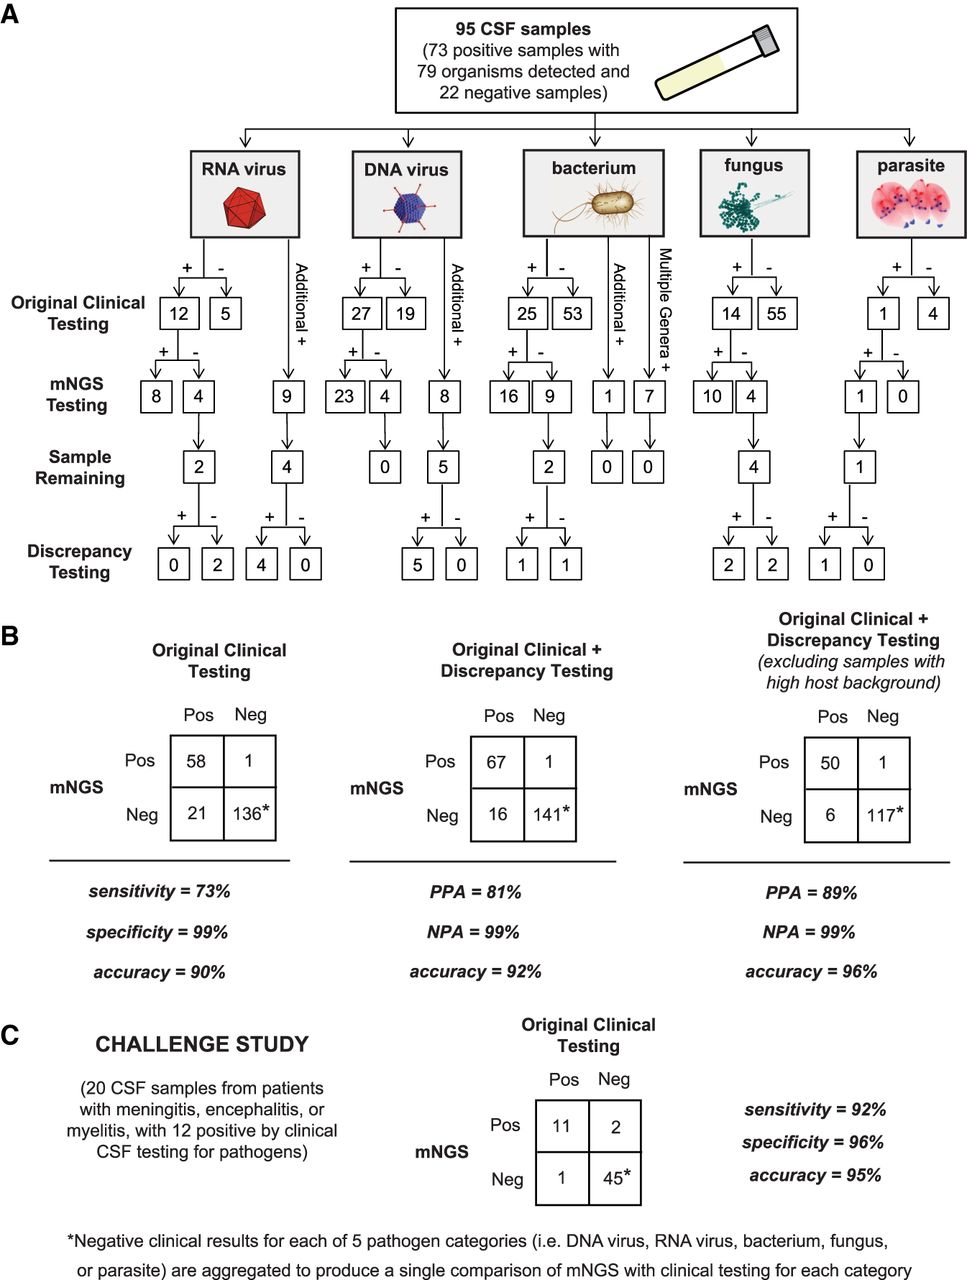
Accuracy of mNGS relative to clinical testing of CSF. (A) Flow chart of results from samples evaluated in the accuracy study. Results are separated by organism category (RNA virus, DNA virus, bacterium, fungus, and parasite). Shown are the number of samples positive or negative by clinical testing (first row), agreement between mNGS results and positive clinical results and additional positive detections by mNGS (second row), and, in samples with sufficient remaining volume (third row), the results of orthogonal confirmatory testing (fourth row). (B) 2 × 2 contingency tables comparing the performance of mNGS relative to clinical testing of CSF. The composite reference standards used are original clinical testing (left), combined original clinical and discrepancy testing (middle), and combined original clinical and discrepancy testing after excluding high host background samples (right). (PPA) Positive predictive agreement, (NPA) negative predictive agreement. (C) 2 × 2 contingency table showing the results of challenge study. Twenty CSF samples were analyzed by mNGS and compared with the results of conventional clinical testing.


