
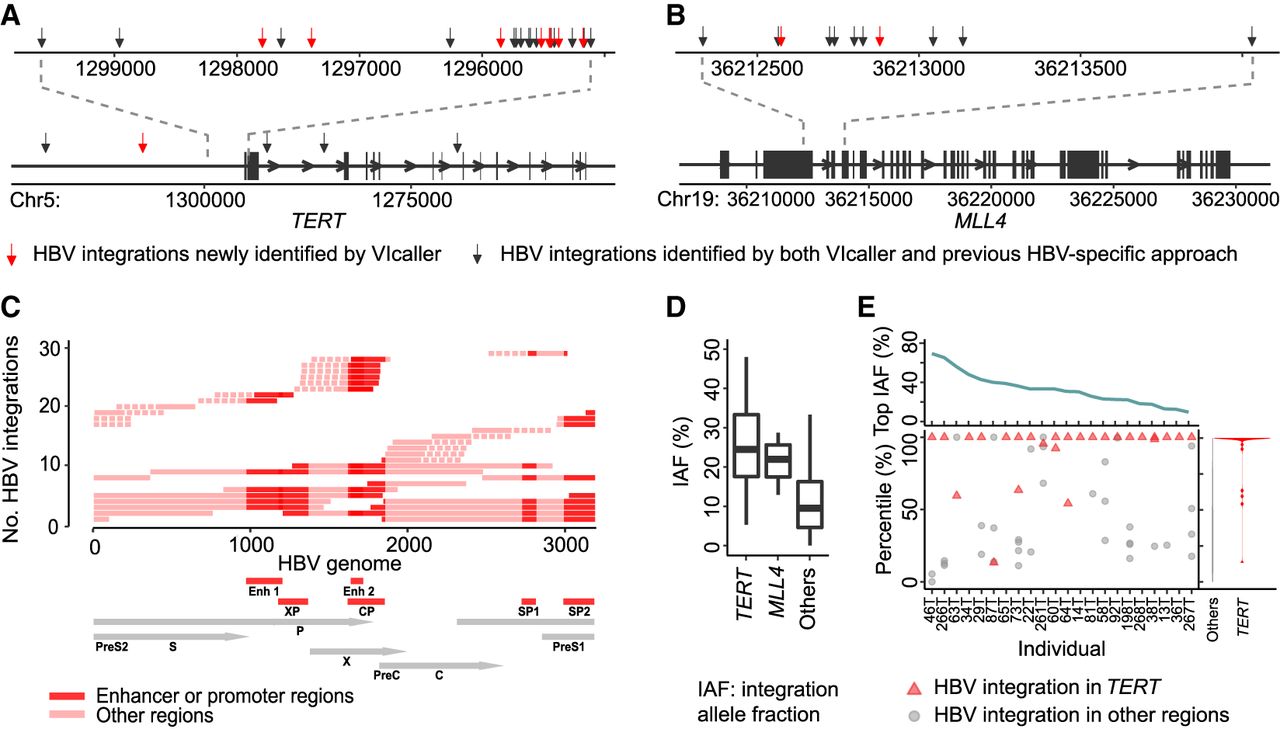
Characteristics of HBV integrations identified in tumors. (A,B) Sites of HBV integrations in two oncogenes: (A) TERT; (B) MLL4. (C) The integrated HBV sequences in TERT. The solid red lines above the HBV genome represent the integrated sequences with both breakpoints identified, whereas the dotted lines represent those with only one breakpoint identified. The HBV genes are in gray, and the promoters and enhancers are in red. (D) Comparison of integration allele fractions among HBV integrations in TERT, MLL4, and other chromosomal regions. (E) Integration allele fraction comparison of all HBV integrations in the samples with integrations in TERT. The top shows the highest integration allele fraction in each sample. The bottom left shows all HBV integrations in each sample, including those in TERT, and other regions (except MLL4). The bottom right shows the violin plot distributions of allele fractions of integrations in TERT compared to those in other regions (except MLL4). The result for MLL4 is shown in Supplemental Figure S9.


