
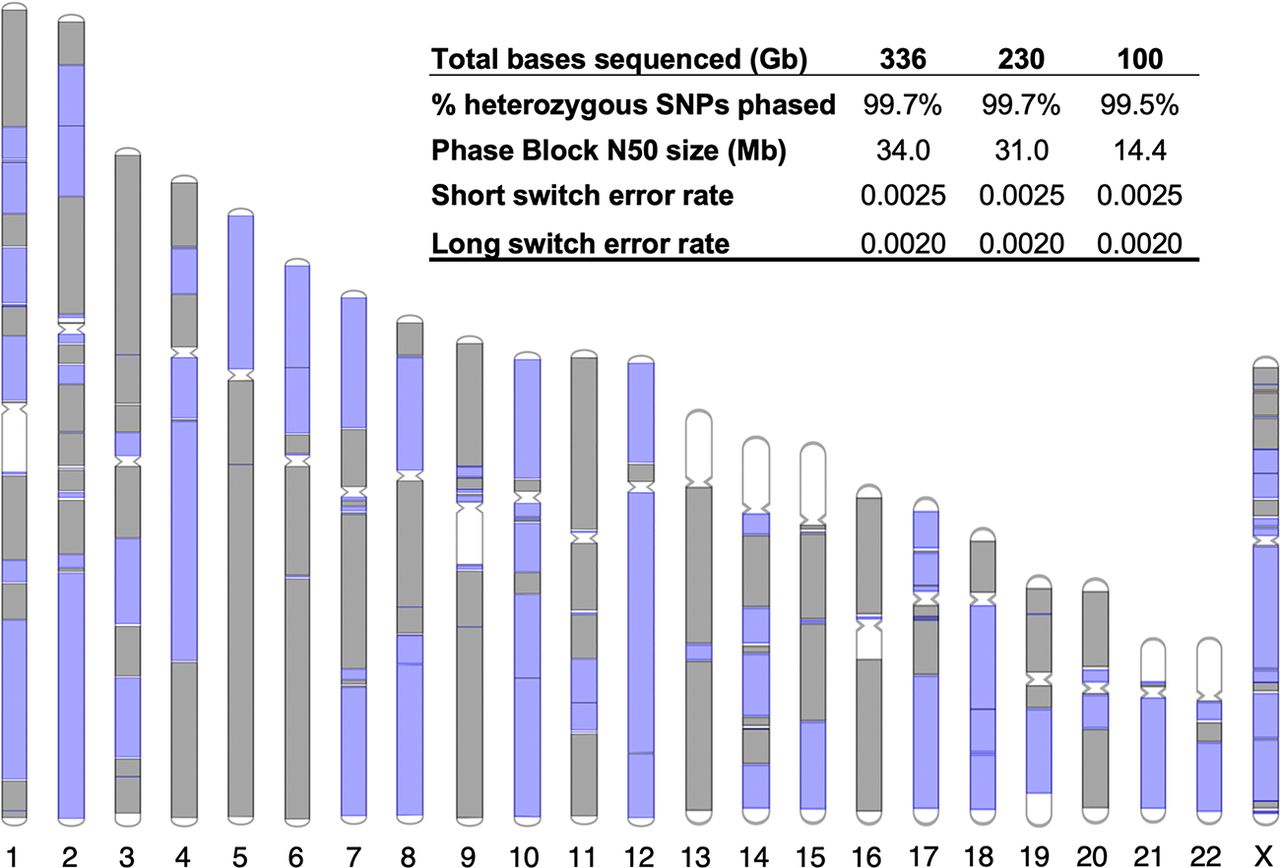
Figure 2.
stLFR-1 phasing performance. The 221 phased blocks from the stLFR-1 library are depicted on chromosomes as alternating colors of gray and purple. Unphased regions are depicted in white. The inset table shows the performance of phasing with different sequence read coverage levels.


