
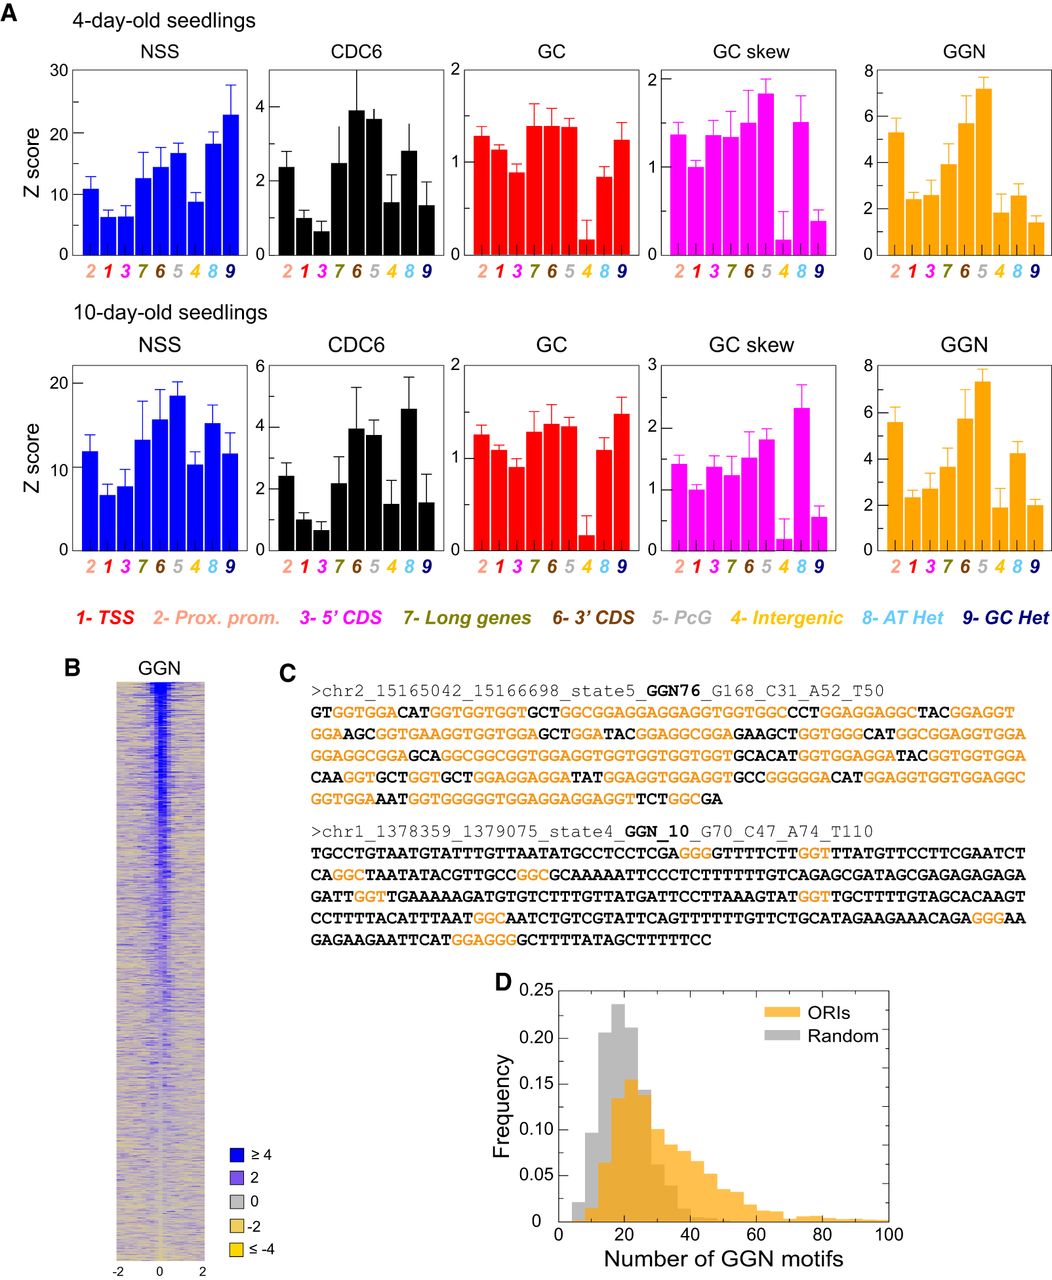
Relevance of several genomic variables for ORI specification. (A) The weighted averages of the Z-scores for several variables (NSS, CDC6, GC content, GC skew, and GGN trinucleotide) are shown for each chromatin state, normalized with the average property across the entire genome and weighted with the combined NSS. The results of the three independent experiments are shown in Supplemental Figure S6. NSS values were statistically significant when comparing states 1 and 3 with states 5, 8, and 9 (two-tailed t-test P < 0.0001) in all cases except for state 3 and state 9 (P < 0.0046 and P < 0.0002 in 10- and 4-d-old seedlings, respectively). (B) Heatmaps of the GGN signal (square root) within ±2 kb of the ORI midpoint (0). ORIs have been ranked according to the first principal component of the complete set of features, computed over all 2374 ORIs. (C) Examples of the DNA sequences within ±150 nt of the ORI midpoint highlighting the GGN motifs (orange). In these two ORIs, 76 and 10 GGN motifs were present. The complete list of ORI sequences is provided in Supplemental Table 3. (D) Distribution of ORIs (n = 2374) with different number of GGN motifs (orange; Mean = 33.8, SD = 17.9) compared with the same number of randomly chosen genomic regions (gray; Mean = 20.6, SD = 7.4). Two-tailed t-test, P > 0.0001.


