
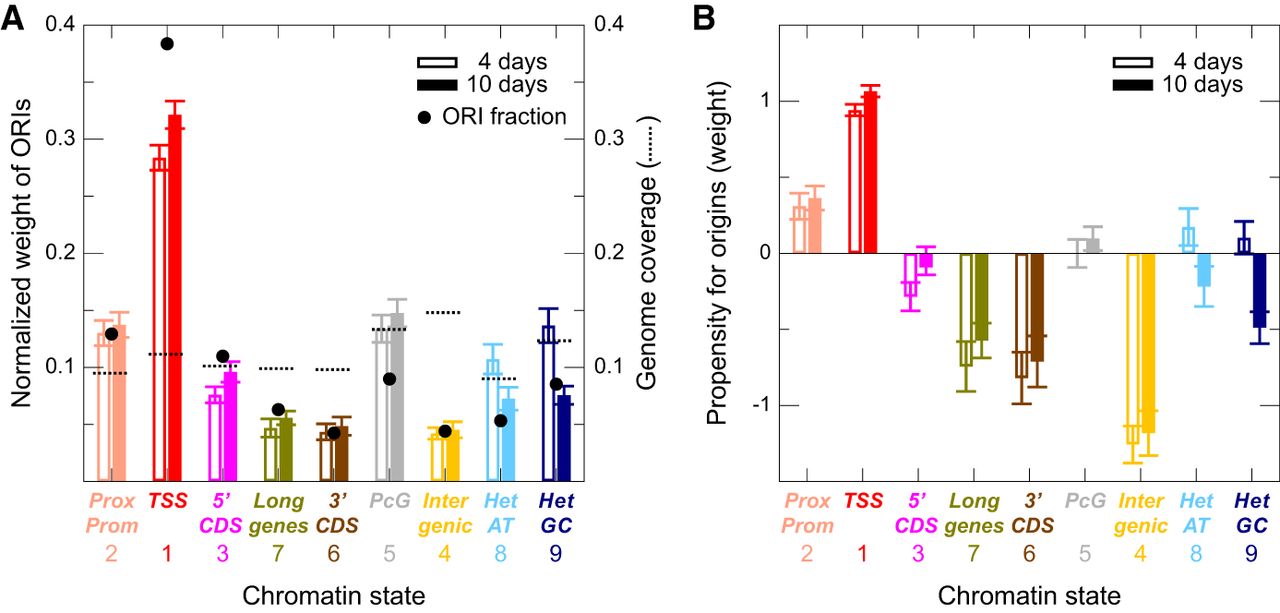
Association of ORIs with chromatin states. (A) Normalized weight of ORIs belonging to the nine chromatin states in the combined experiments of 4-d-old (transparent color) and 10-d-old (solid color) seedlings. The results of the three independent experiments are shown in Supplemental Figure S5A. Black circles indicate the fractions of ORIs in each chromatin state, and broken lines indicate the genome coverage of each chromatin states (both using the same scale of the y-axis). (B) Same as A, showing the propensity (instead of the cumulative weight) for ORIs in the nine chromatin states depicted. This reveals ORI types according to the associated chromatin states that have larger NSS than expected by chance based on the fraction of genome that they represent. The results of the three independent experiments are shown in Supplemental Figure S5B.


