
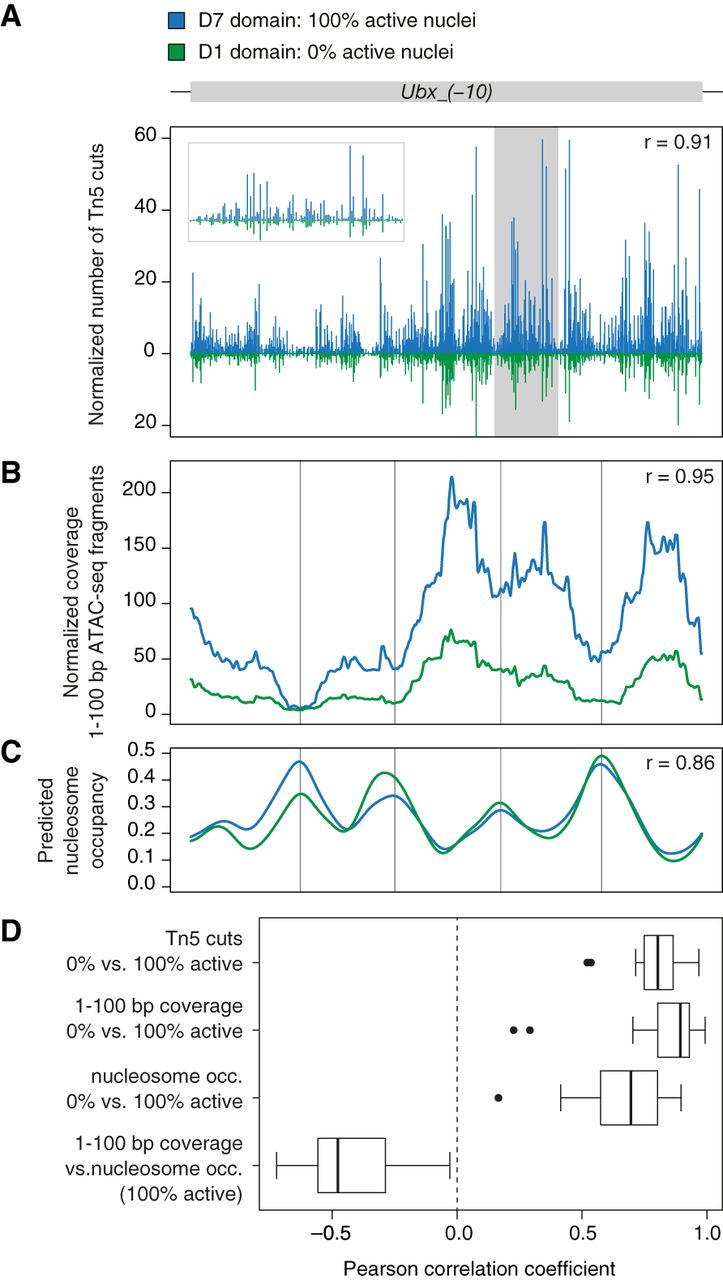
Local accessibility modulation within axis patterning enhancers. (A) Normalized frequency of Tn5 transposase cleavages, (B) normalized coverage of 1- to 100-bp nucleosome-free ATAC-seq fragments, and (C) predicted nucleosome occupancy along Ubx_(−10) enhancer in D7 domain (blue; 100% active nuclei) and D1 domain (green, 0% active nuclei). Inset in a gray frame represents magnification of the shaded region. Nucleosome occupancy was predicted with NucleoATAC (Schep et al. 2015). r = Pearson correlation coefficient of the compared profiles. (D) Box plots show distribution of correlation coefficients across all AP enhancers. Distribution of transposase cuts, coverage of 1- to 100-bp ATAC-seq fragments and predicted nucleosome occupancy was compared between tagged domains with 100% active and 0% active nuclei. Coverage of 1- to 100-bp fragments was compared with the predicted nucleosome occupancy in tagged domains representing active enhancer states.


