
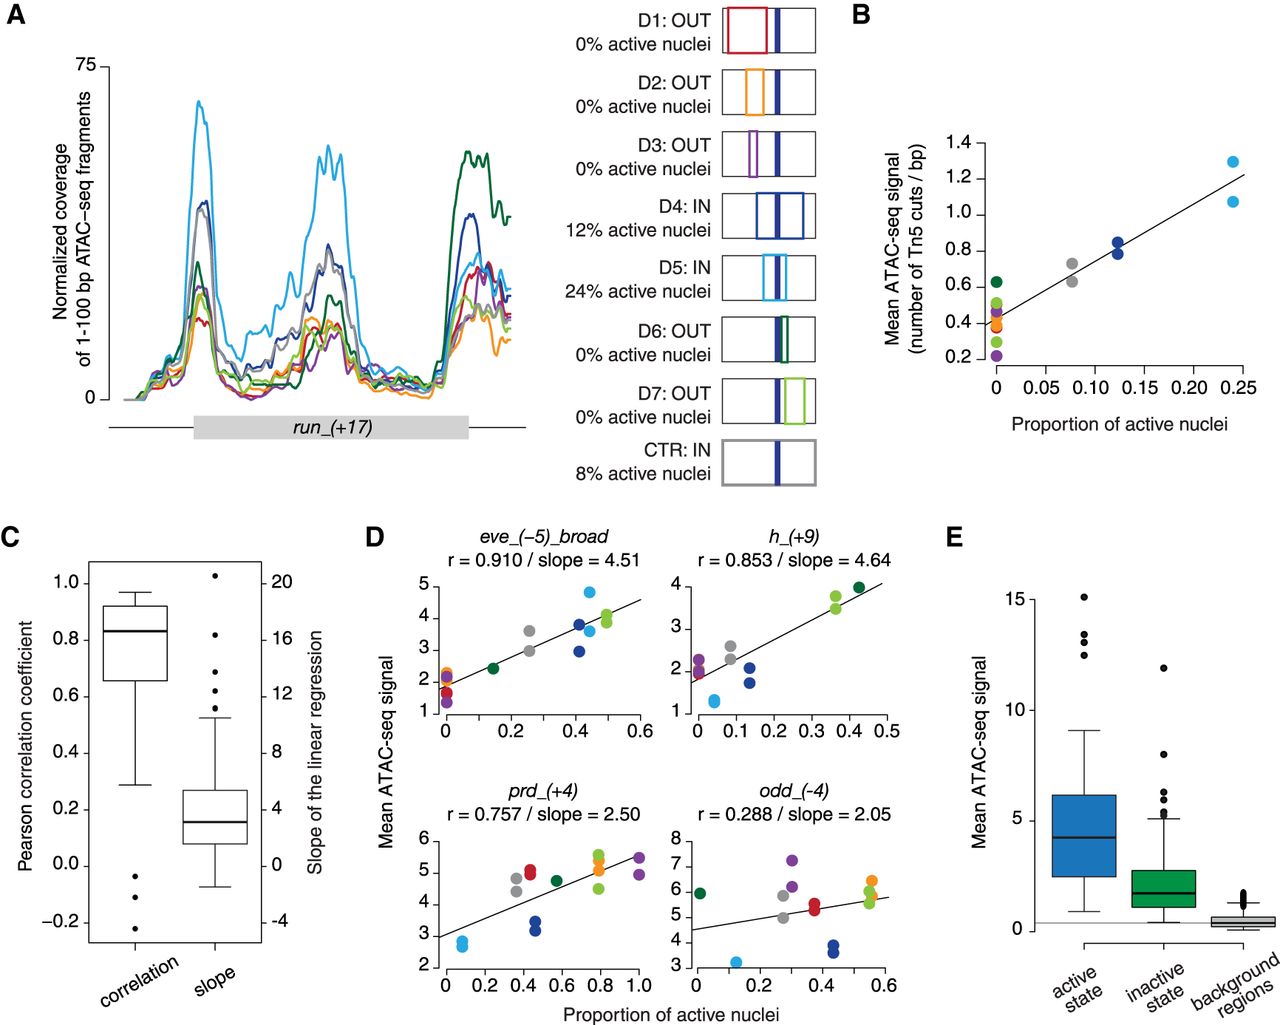
Accessibility of AP enhancers is highly correlated with their transcriptional output. (A) Coverage of 1- to 100-bp ATAC-seq fragments over an enhancer of runt, run_(+17), measured in D1–D7 domains and a whole-embryo control (mean over replicates). Domains are color-coded as in the schematic that shows their positions along the AP axis and with respect to the activity pattern of the enhancer (dark blue). (B) ATAC-seq signal (mean number of Tn5 transposase cuts per bp) plotted against the proportion of an embryonic domain in which the enhancer is active (active nuclei). Each point represents an individual replicate of D1–D7 samples and whole-embryo controls (pooled replicates from multiple strains), color-coded as in panel A. D6 replicate 1 is excluded due to its close similarity to whole-embryo controls (Fig. 3A). (C) Box plot represents distribution of correlation coefficients and linear regression slopes across 88 AP enhancers. (D) Scatter plots of example enhancers, each representing a different quarter of correlation coefficients (all enhancers in Supplemental Fig. S14). (E) Box plots show ATAC-seq signal distribution (mean number of Tn5 transposase cuts per bp) of active AP enhancers (signal from tagged domains with 100% active nuclei; active state), inactive AP enhancers (signal from tagged domain with 0% active nuclei; inactive state), and 9309 background regions of the genome (mean signal across all tagged domains; background regions).


