
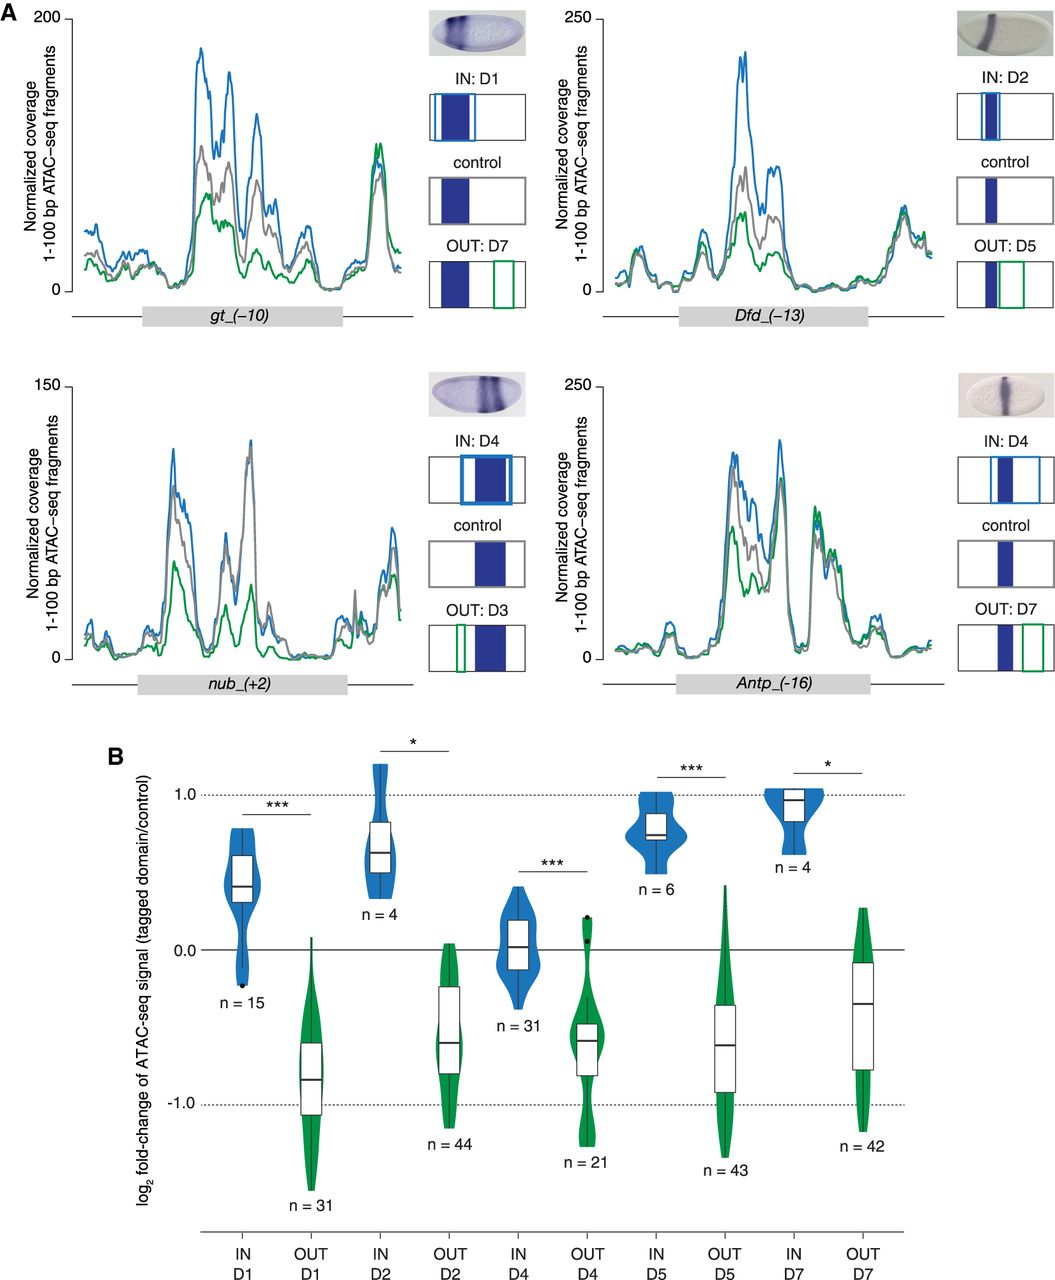
Elevated accessibility of AP enhancers in tagged domains coincides with their activity. (A) Coverage of 1- to 100-bp ATAC-seq fragments (mean over two replicates) of four selected AP enhancers. Comparison between a whole-embryo control (control: gray), a tagged domain that encompasses the enhancer's activity pattern (IN: blue), and a tagged domain from which the enhancer's activity is excluded (OUT: green). Activity pattern along the AP axis is indicated schematically in dark blue, with color-coded outlines representing positions of respective domains. RNA in situ hybridization images of a reporter gene: gt_(−10) and nub_(+2) (reprinted from Schroeder et al. 2004), Dfd_(−13) (reprinted from Fisher et al. 2012), and Antp_(−16) (reprinted from Kazemian et al. 2010). (B) Violin plots show distribution of log2 fold-changes of ATAC-seq signal (total count of Tn5 transposase cuts, mean over two replicates) between a given tagged domain and its corresponding whole-embryo control, over two classes of AP enhancers: IN (blue) and OUT (green). Asterisks indicate significant differences between IN and OUT enhancers (Student's t-test); (*) P-value < 0.05, (***) P-value < 0.0001. Numbers of enhancers in each class are indicated below individual plots. Domains D3 and D6 are not presented; due to their limited size, none of the AP enhancers had its activity pattern fully included in the domains.


