
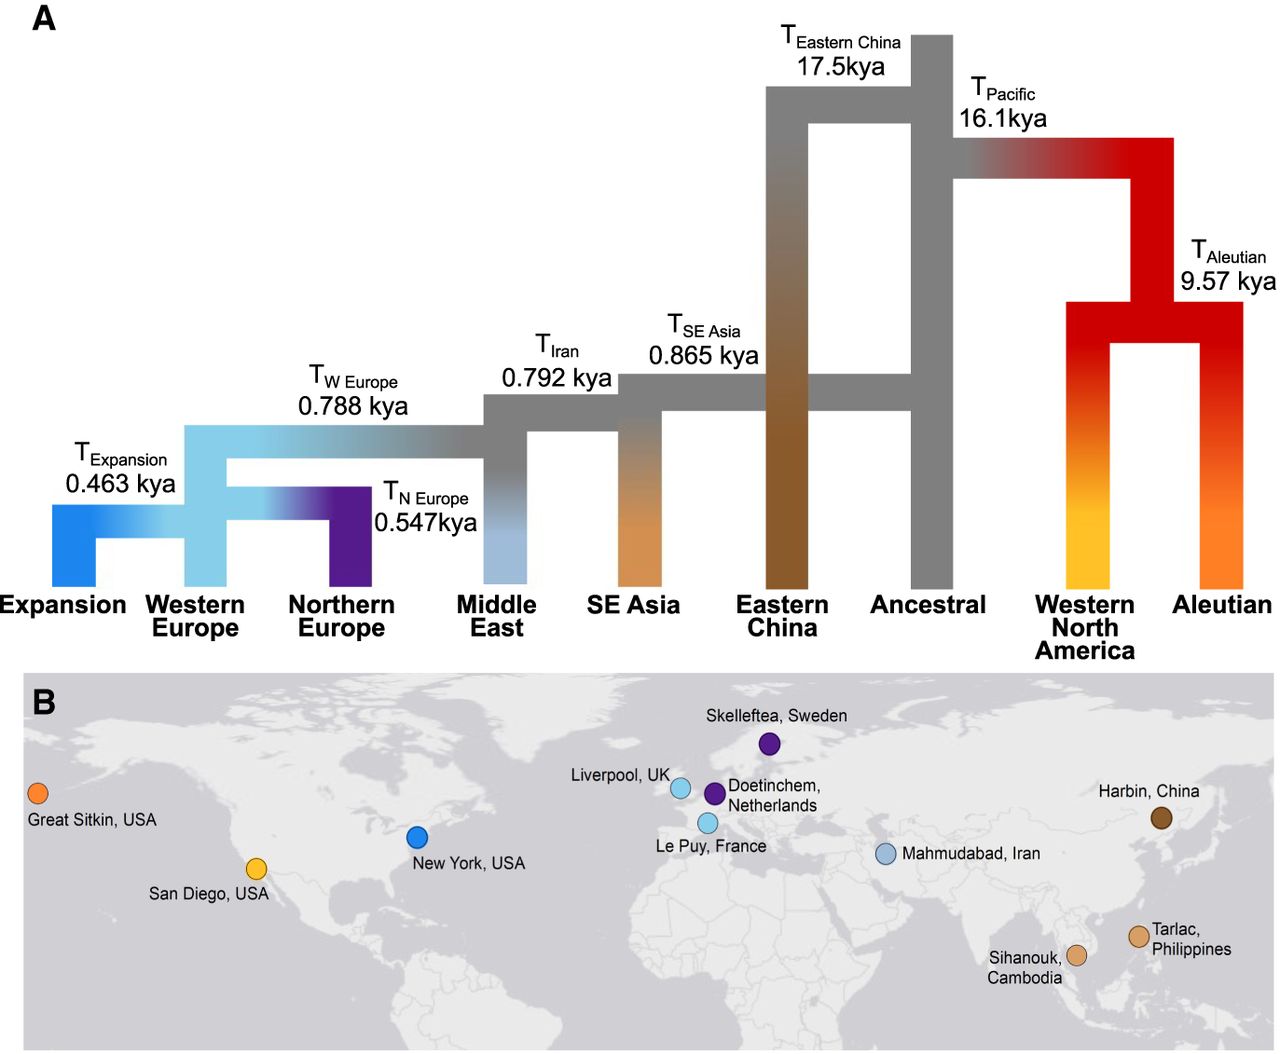
Figure 3.
Inferred population tree topology and divergence times for the global expansion of brown rats. (A) The best-supported demographic model contained nine evolutionary clusters inclusive of two unsampled populations. The divergence times in generations and Ne are listed in Table 1. (B) Map of global sampling locations for the WGS demographic model in which evolutionary clusters were represented by different colors: Eastern China, dark brown; SE Asia, light brown; Aleutian, orange; Western North America, yellow; Middle East, gray-blue; Northern Europe, purple; Western Europe, light blue; and Expansion, medium blue.


