
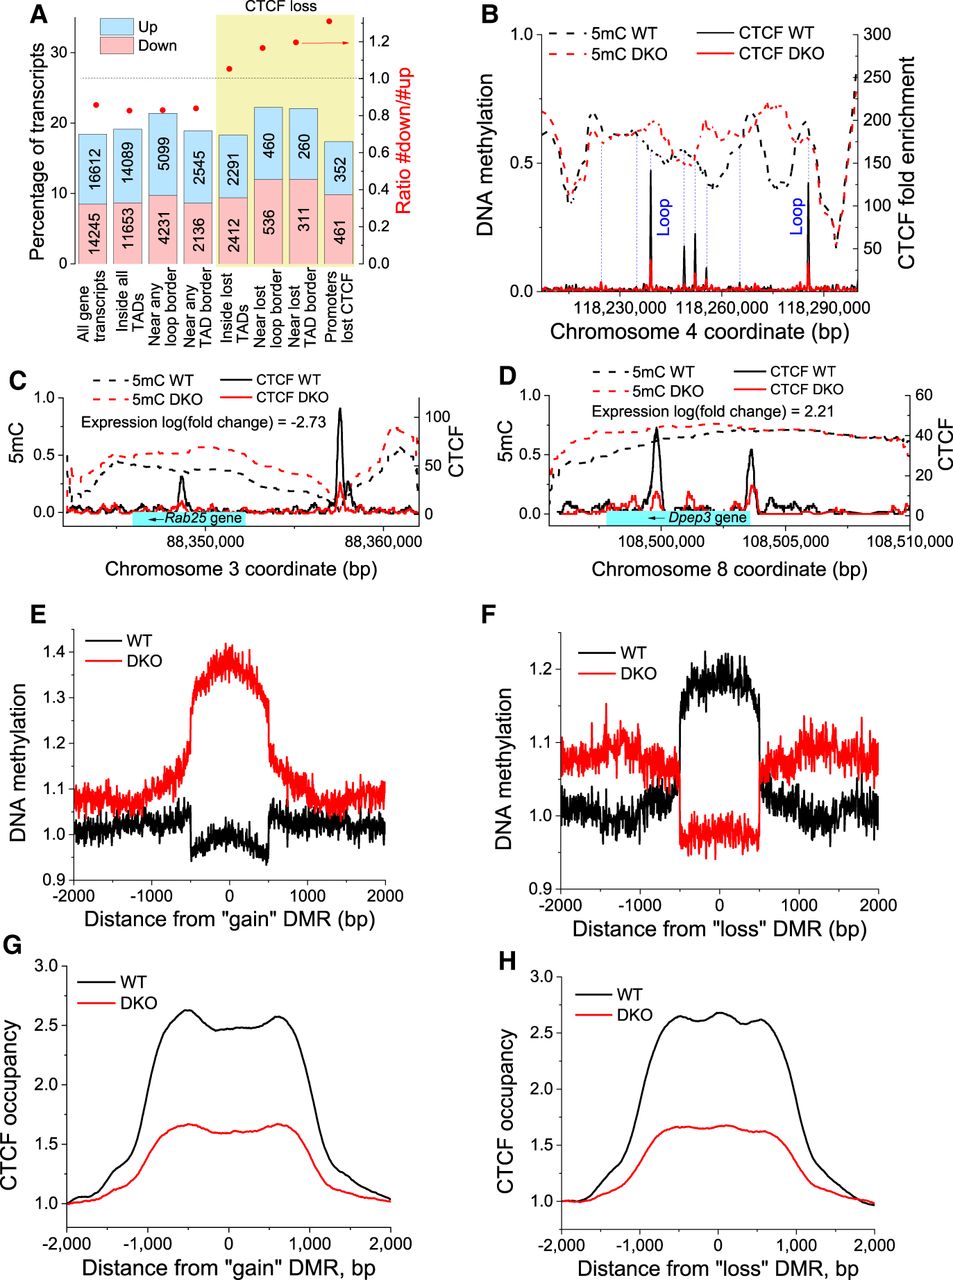
Tet1/2 knockout changes DNA methylation profiles separated by CTCF and influences gene expression. (A) Changes of gene expression upon Tet1/2-dependent loss of CTCF from functional genomic regions. The bars show percentages of up- and down-regulated transcripts with respect to all transcripts overlapping with a given feature. The values on the bar indicate the corresponding numbers of transcripts in each category. Bars numbered left to right: (1) all transcripts genome-wide; (2) transcripts inside all TADs; (3) transcripts within 10 kb from any loop boundary; (4) transcripts within 10 kb from any TAD boundary; (5) transcripts located within TADs that lost a boundary (a boundary was called lost if there was at least one lost CTCF site within 10 kb from the boundary); (6) transcripts within 10 kb from any lost loop boundary based on the same criterion for the boundary loss; (7) transcripts within 10 kb from any lost TAD boundary based on the criterion for the boundary loss; and (8) transcripts that lost CTCF from their promoters. The yellow area indicates features that lost CTCF. The red points correspond to the ratio of the numbers of down- versus up-regulated transcripts indicated on the right axis. (B–D) Example genomic regions showing the DNA methylation pattern smoothed with a 500-bp sliding window as it changes between WT and DKO cells. Thick dashed lines show average 5mC level per CpG, and solid lines show CTCF occupancy in WT (black) and DKO (red) ESCs. Thin blue dashed lines indicate peaks of CTCF occupancy. Some of these coincide with chromatin loop borders reported by Bonev et al. (2017) (indicated on the figure). Light blue rectangle shows the gene body. The arrow indicates direction of transcription. Gene expression changes are indicated in the figure. (E,F) DNA methylation profiles in WT (black) and DKO (red) cells around centers of 1000-bp regions that were characterized by increased (“gain”) or decreased methylation (“loss”) in DKO ESCs. (G,H) Average CTCF occupancy profiles around “gain” and “loss” DMRs, showing that “gain” DMRs tended to be flanked by CTCF sites. The same effect was observed for “loss” DMRs but was less evident because of a fraction of CTCF sites located in the middle of “loss” DMRs.


