
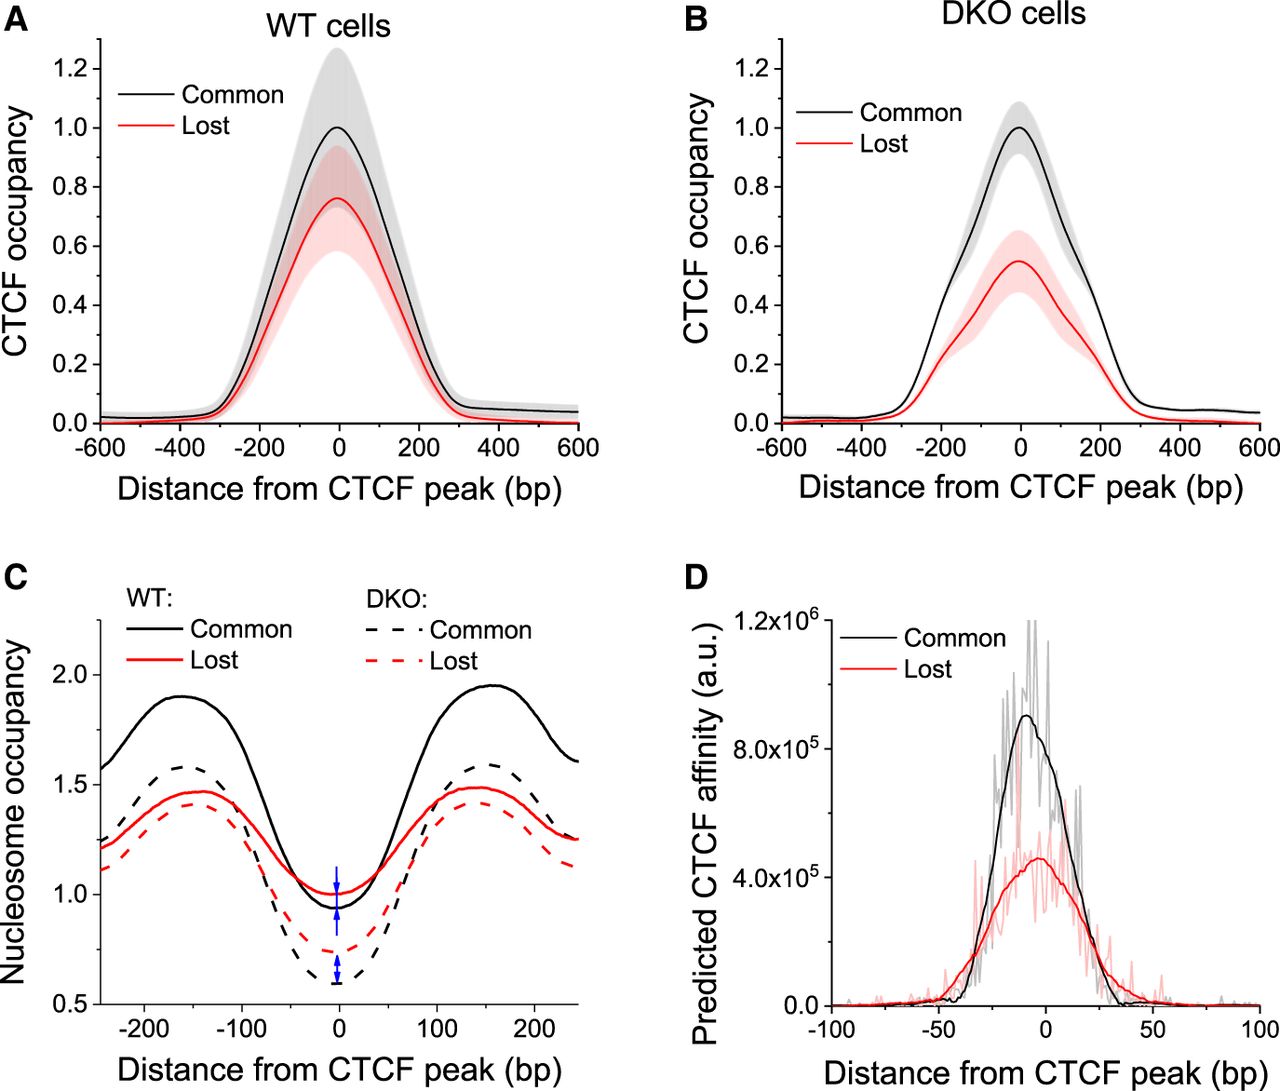
CTCF loss in DKO ESCs is predetermined by weaker DNA sequence affinities at a subset of lost sites. (A,B) Normalized average CTCF occupancy profiles around common and lost CTCF sites in WT (A) and DKO cells (B). Black line indicates common sites; red line, lost sites. Gray and light red shaded areas show the corresponding standard deviation. (C) Normalized average nucleosome occupancy profiles around common and lost CTCF sites in WT and DKO ESCs. Blue arrows show that nucleosome occupancy at lost sites was higher than at common sites both in WT and DKO cells, but in DKO ESCs, this difference becomes larger. (D) CTCF affinity predicted by the biophysical model from the DNA sequence for regions around common and lost CTCF sites was about twofold higher for common sites.


