
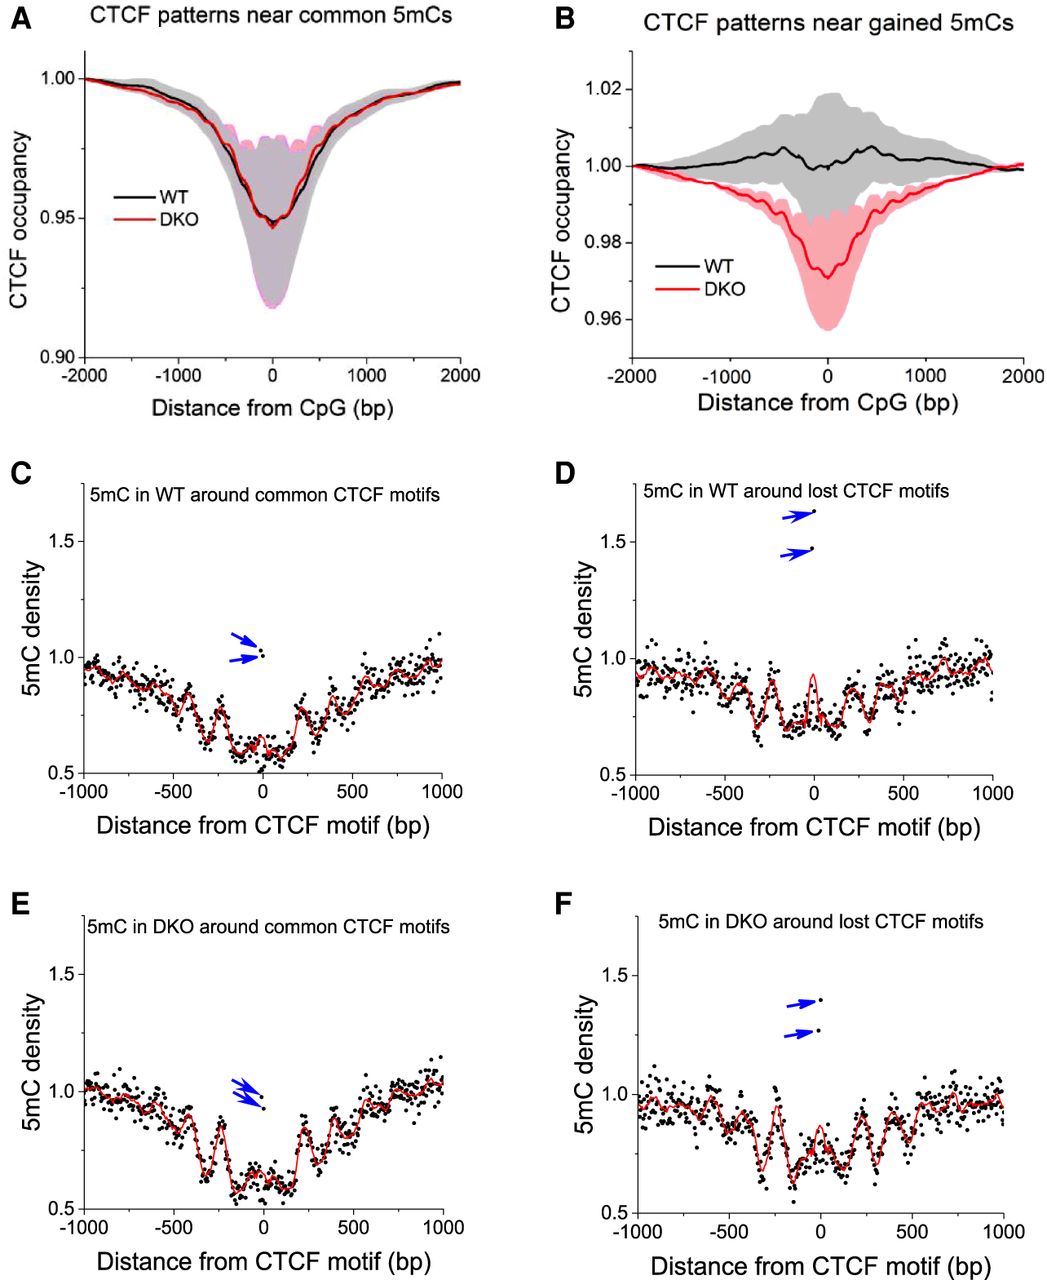
Genome-wide CTCF rearrangement happens preferentially at CpGs that gain methylation in DKO ESCs. (A) The average CTCF occupancy profiles around commonly methylated CpGs (methylation >0.8 both in WT and DKO cells; N = 10,505,682). (B) Depletion of CTCF occupancy around CpGs that gain methylation in DKO ESCs (<20% methylation in WT, >50% methylation in DKO cells; N = 9,739,847). CTCF profiles have been first calculated for individual replicate experiments and then averaged for all available replicates correspondingly for each cell type. Gray/light red shaded areas show the standard deviations of this averaging. (C–F) 5mC density around common and lost CTCF motifs in WT and DKO cells. Black dots correspond to individual CpG positions, red lines represent a spline interpolation of their density, and blue arrows indicate outstanding CpGs inside the CTCF binding motif.


