
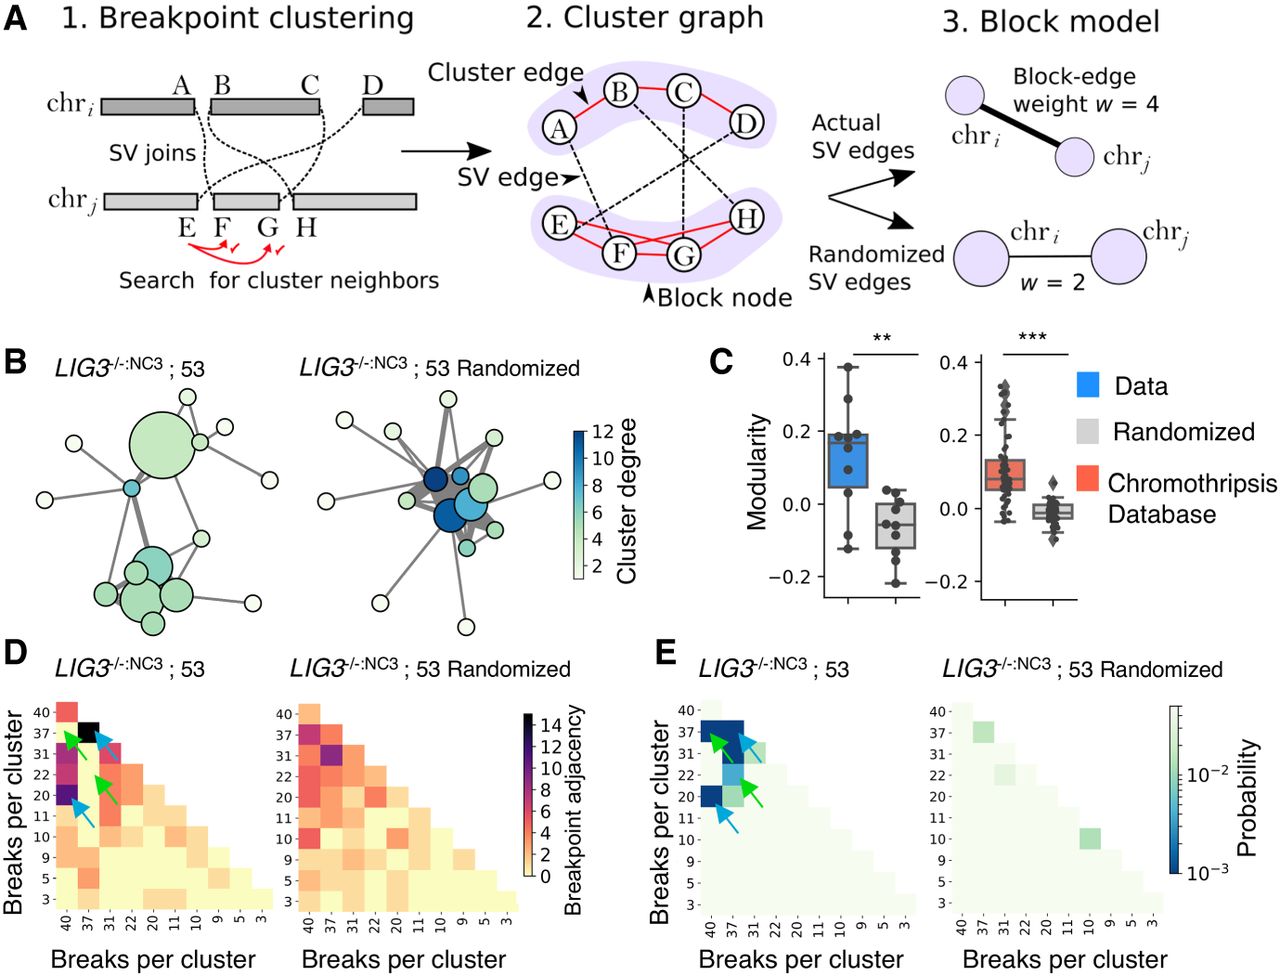
Network analysis reveals genome catastrophe joining is nonrandom. Chained breakpoints were grouped into local clusters using a statistical clustering procedure (A1) and represented as a cluster graph (A2). Components of the cluster graph that were connected by cluster edges (red edges, A2) were partitioned using a block model, so each node in the block model corresponds to a single cluster of breakpoints (A3). The example in A shows two clusters of breakpoints on chri and chrj that are then partitioned into a block model with two nodes. Block-node diameter relates to the numbers of intracluster SVs, whereas edge thickness (weight [w]) symbolizes the number of SVs between two clusters. Block-node color represents the degree or number of SVs between all neighboring clusters. (B) A chain from LIG3−/−:NC3; sample 53 has been displayed in this manner along with an equivalent graph with randomized SV edges to reflect a random end-joining process. (C) The modularity coefficient for all chain-graphs was calculated, alongside data downloaded from the chromothripsis database (Yang et al. 2016). (D) Block models were represented as adjacency matrices, with each row and column corresponding to a cluster of breakpoints with the color depicting the number of intercluster SVs (nondiagonal cells) or intracluster SVs (diagonal cells). (E) Using simulation, the distributions of adjacency values were determined for the randomized data, allowing the probability of the observed adjacency values to be estimated, assuming a random model of end joining. Blue arrows in D and E highlight examples of clusters with more linkages than expected, whereas green arrows indicate fewer linkages.


