
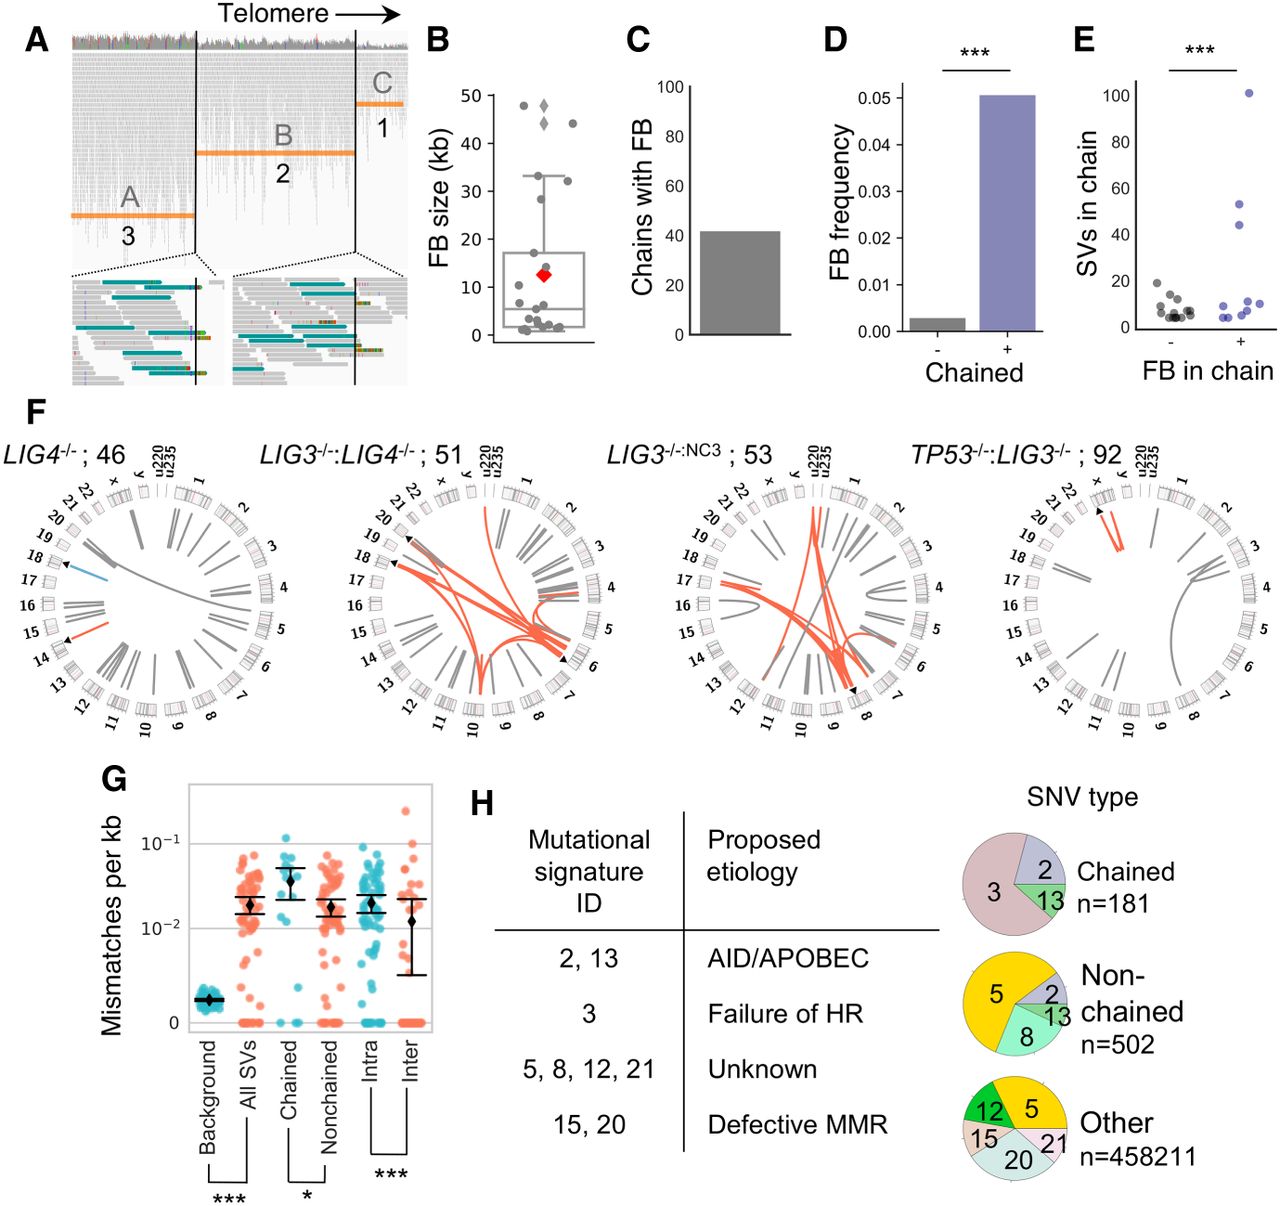
Mutational processes associated with chained rearrangements. (A) FB inversions were identified by a stepped CN profile across an inverted segment. The size distribution of FBs (B), the percentage of chains with a FB (C), and the FB frequency per chain (D) are displayed, along with the number of SVs per chain in the presence or absence of a FB (E). (F) Circos plots show chained SVs using red or blue arcs, with FB positions indicated as black arrows and nonchained SVs drawn as gray arcs. Mismatch rates in regions surrounding SV breaks were quantified (G), and the mutational signatures of different classes of SNVs were analyzed and plotted as pie charts, with colors depicting the different mutational signatures identified (H). (*) P-value 0.015; (***) P-value <4 × 10⁻⁶; Mann–Whitney U test (D,G), Fligner–Kileen test (E).


