
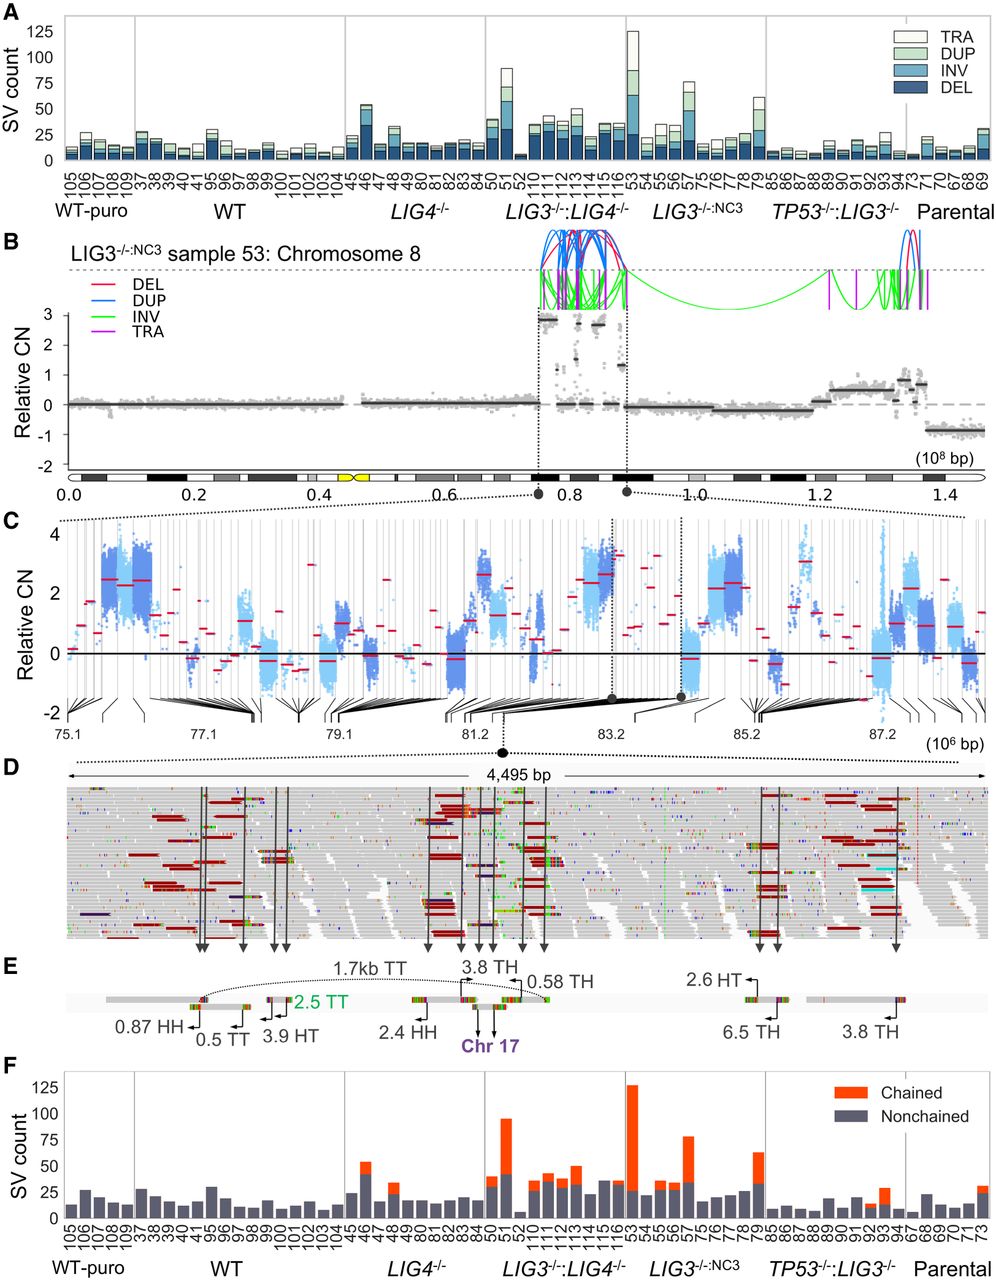
Identification of genome catastrophe in post-crisis clones. (A) The number of deletions (DEL), inversions (INV), duplications (DUP), and translocations (TRA) for all samples were quantified. (B–E) An example of a complex rearrangement is illustrated. To visualize the dense spatial clustering of breaks present in B, the lengths of segments separating neighboring breakpoints were transformed to a log10 scale. A region from Chr 8, indicated by black dotted lines, has been transformed in this way with the linear scale illustrated in the lower half of panel C. A further subsection of this rearrangement, highlighted with black dotted lines, is expanded in D, showing a 4.5-kb span with 14 breakpoints. (E) Assembly of discordant reads from this region was performed to aid in interpretation. Join types are given by a two-letter code corresponding to the head (H) or tail (T) ends of fragments. The distance to partner fragments is given in Mb with the arrow specifying the direction. The breakpoint colored in green was missed during SV calling. (F) Applying a clustering procedure, the number of SVs that resembled a chainlike pattern was quantified for each sample.


