
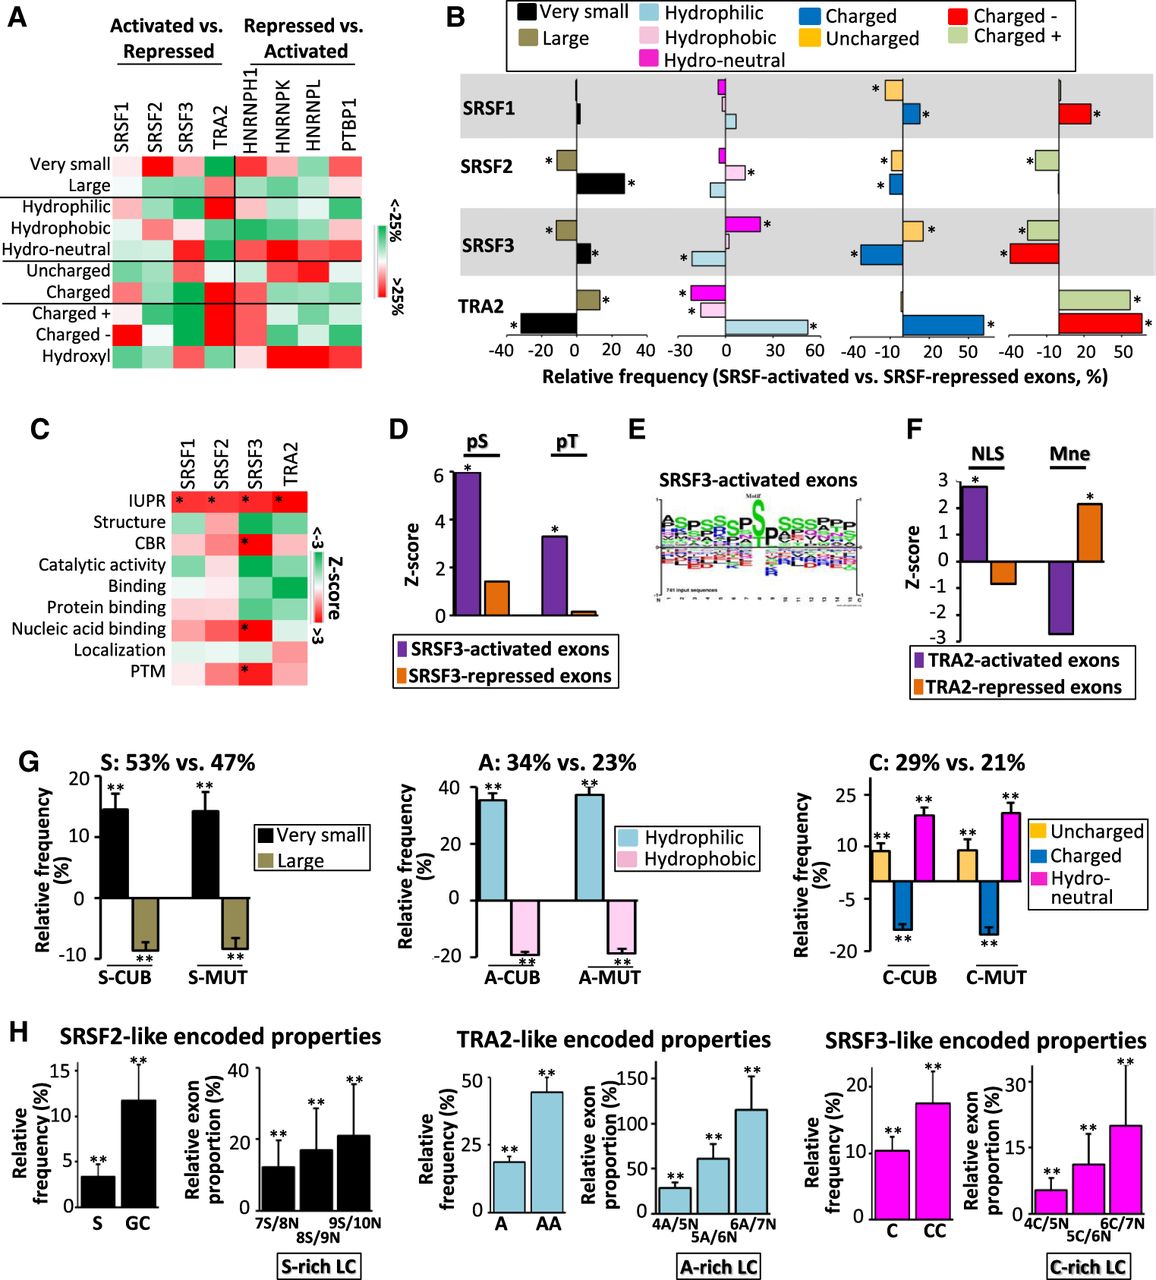
Bidirectional interplay between splicing regulatory process and its functional outcome. (A) Color code corresponding to the relative frequency (%) of amino acid physicochemical properties as indicated, when comparing all the SRSF1-, SRSF2-, SRSF3-, and TRA2-activated exons to all the SRSF1-, SRSF2-, SRSF3-, and TRA2-repressed exons, respectively, or when comparing all the HNRNPH1-, HNRNPK-, HNRNPL-, and PTBP1-repressed exons to all the HNRNPH1-, HNRNPK-, HNRNPL-, and PTBP1-activated exons, respectively. The sets of exons used correspond to exons regulated by a given splicing factor in at least one cell line and being regulated in the same manner when regulated in multiple cell lines. (B) Relative frequency (%) of very small, large, hydrophilic, neutral, hydrophobic, charged, uncharged, negatively charged (charged −), and positively charged (charged +) amino acids when comparing all the SRSF1-, SRSF2-, SRSF3-, or TRA2-activated exons to all the SRSF1-, SRSF2-, SRSF3-, or TRA2-repressed exons, respectively. The sets of exons used correspond to exons regulated by a given splicing factor in at least one cell line and being regulated in the same manner when regulated in multiple cell lines: (*) Mann–Whitney U test FDR < 0.05. (C) Color code corresponding to the Z-score of annotated protein features encoded SRSF1-, SRSF2-, SRSF3-, and TRA2-activated exons compared to all human coding exons: (IUPR) intrinsically unstructured regions; (CBR) compositionally biased protein region; (PTM) post-translational modifications; (*) Mann–Whitney U test FDR < 0.05. (D) Z-score of experimentally validated phosphorylated serine (pS) and threonine (pT) encoded by SRSF3-activated and -repressed exons compared to all human coding exons: (*) Mann–Whitney U test FDR < 0.05. (E) Sequence logo generated from PhosphoSitePlus (Hornbeck et al. 2015) using sequences surrounding experimentally validated phosphorylated residues coded by SRSF3-activated exons. (F) Z-score of nuclear localization signal (NLS) and intramembrane peptides (Mne) terms encoded by TRA2-activated and -repressed exons compared to all human coding exons: (*) Mann–Whitney U test FDR < 0.05. (G, left) The relative frequency (%) of very small and large amino acids encoded by 100 sets of 300 generated-exonic sequences containing a high frequency (53%) of the S nucleotide (S-CUB and S-MUT) compared to 100 sets of 300 generated-exonic sequences containing a low S-nucleotide frequency (47%); (middle) the relative frequency (%) of hydrophilic and hydrophobic amino acids encoded by exonic sequences containing a high frequency (34%) of A nucleotide (A-CUB and A-MUT) compared to exonic sequences containing a low A-nucleotide frequency (23%); (right) the relative frequency (%) of polar uncharged, charged, and neutral (in terms of hydropathy) amino acids encoded by exonic sequences containing a high frequency (29%) of Cs (C-CUB and C-MUT) compared to exonic sequences containing a low C-nucleotide frequency (21%); (**) t-test P-value <1 × 10⁻¹⁴. (H, left) The relative frequency (%) of the S nucleotide and GC dinucleotide, as well as the relative proportion (%) of exons with S-rich low-complexity (LC) sequences of 100 sets of 300 mutated exons encoding for the same physicochemical properties as SRSF2-activated exons compared to 100 sets of 300 mutated exons encoding for the same physicochemical properties as SRSF2-repressed exons; (middle) the relative frequency (%) of the A nucleotide and AA dinucleotide, as well as the relative proportion (%) of exons with A-rich low-complexity sequences of mutated exons encoding for the same physicochemical properties as TRA2-activated exons compared to mutated exons encoding for the same physicochemical properties as TRA2-repressed exons: (right) the relative frequency (%) of the C nucleotide and CC dinucleotide, as well as the relative proportion (%) of exons with C-rich low-complexity (LC) sequences of mutated exons encoding for the same physicochemical properties as SRSF3-activated exons compared to mutated exons encoding for the same physicochemical properties as SRSF3-repressed exons; (**) t-test P-value <1 × 10⁻¹⁴.


