
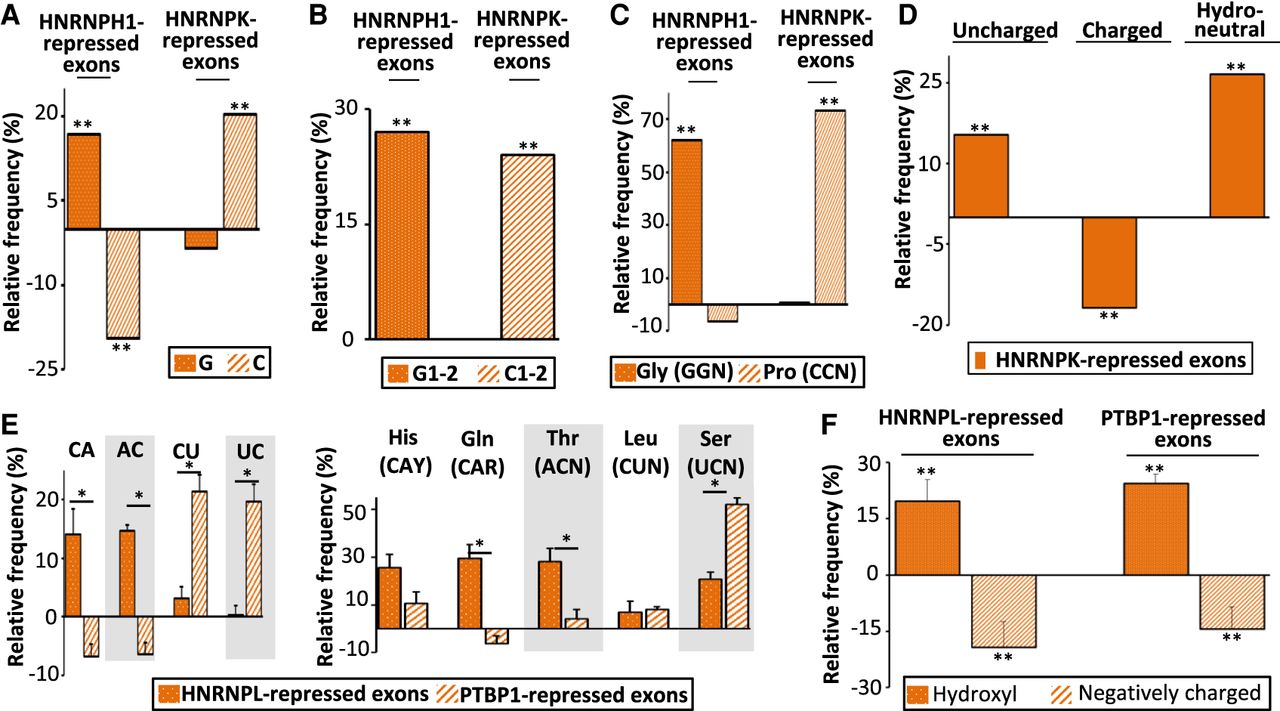
HNRNP-corepressed exons code for amino acids with similar physicochemical properties. (A) Relative frequency (%), when compared to sets of control exons, of G and C nucleotides in HNRNPH1- and HNRNPK-repressed exons identified in 293T and GM19238 cells, respectively: (**) randomization test FDR < 0.006. (B) Relative frequency (%), when compared to sets of control exons, of G (G1–2), or C (C1–2) nucleotides at the first and second codon position from HNRNPH1- or HNRNPK-repressed exons identified in 293T and GM19238 cells, respectively: (**) randomization test FDR < 0.003. (C) Relative frequency (%), when compared to sets of control exons, of glycine (Gly corresponding to GGN codons) and proline (Pro corresponding to CCN codons) encoded by HNRNPH1- and HNRNPK-repressed exons identified in 293T and GM19238 cells, respectively: (**) randomization test FDR < 0.05. (D) Relative frequency (%), when compared to sets of control exons, of polar uncharged, charged, or neutral (in terms of hydropathy) amino acids encoded by HNRNPK-repressed exons identified in GM19238 cells: (**) randomization test FDR < 1 × 10⁻⁴. (E) The left panel represents the average of the relative frequency (%), when compared to sets of control exons of CA, CT, AC, and TC dinucleotides calculated from four sets from different cell lines of HNRNPL- or PTBP1-repressed exons. The right panel represents the average of the relative frequency (%), when compared to sets of control exons of histidine (His corresponding to CAY codons), glutamine (Gln corresponding to CAR codons), leucine (Leu corresponding to CTN codons), threonine (Thr corresponding to ACN codons), and serine (Ser corresponding to TCN codons) encoded by four sets of HNRNPL- and PTBP1-repressed exons. A Mann–Whitney U test was used to compare whether the real frequencies of those amino acids and dinucleotides between HNRNPL- and PTBP1-repressed exons: (*) P-value < 0.03. (F) Relative frequency (%), when compared to sets of control exons, of hydroxyl-containing and negatively charged amino acids encoded by HNRNPL- or PTBP1-repressed exons. The average values of four data sets are represented for HNRNPL and PTBP1: (**) Mann–Whitney U test P-value < 0.03.


