
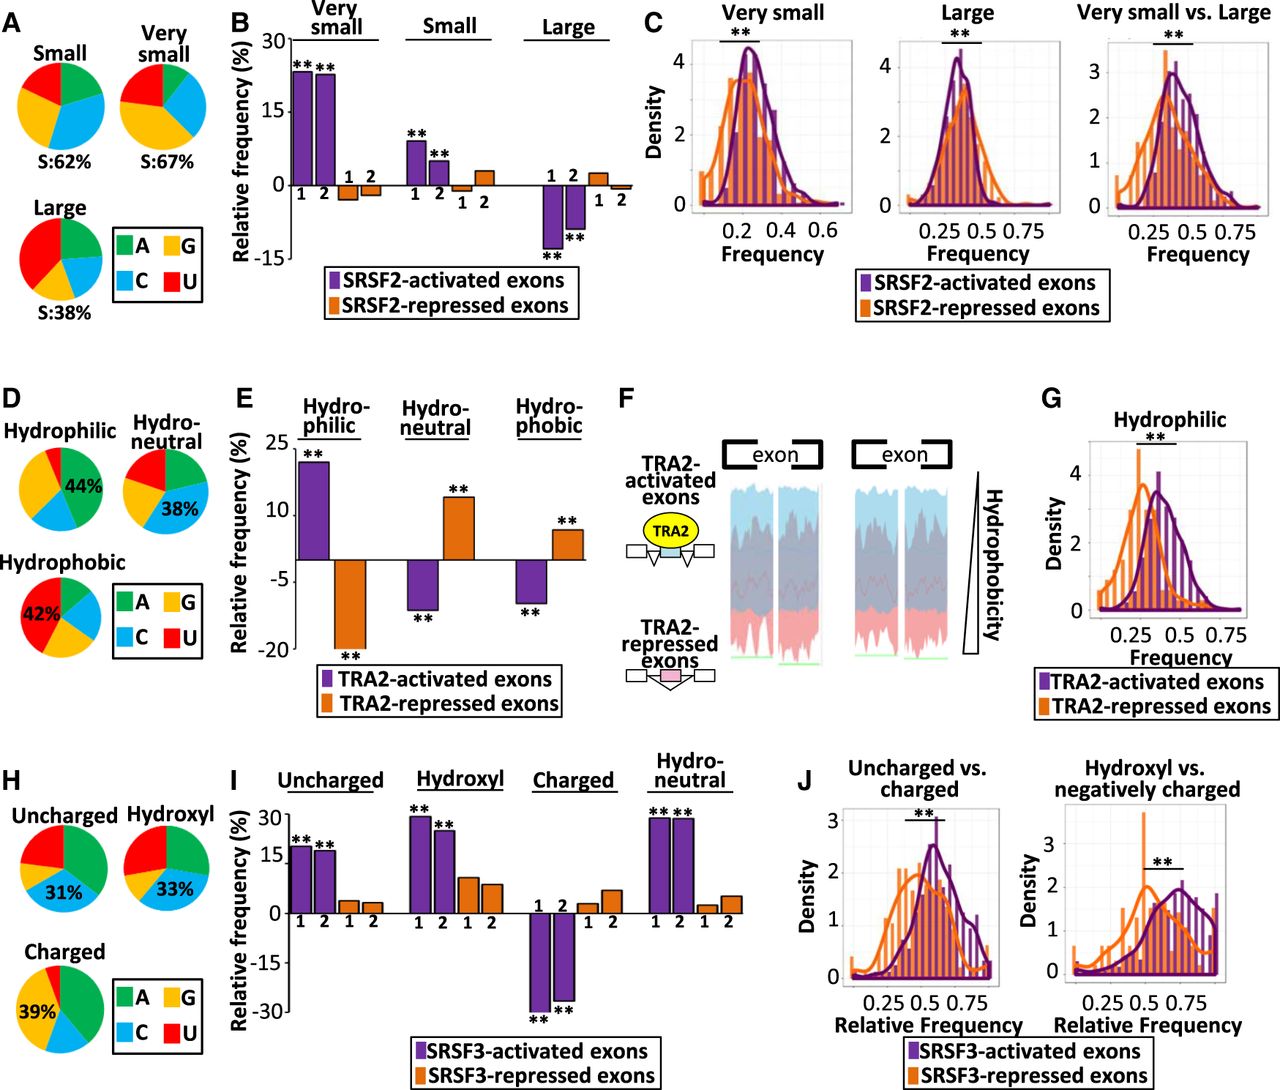
SRSF-coregulated exons code for amino acids with similar physicochemical properties. (A) Nucleotide composition of codons encoding small, very small, and large amino acids: S = G or C. (B) Relative frequency (%), when compared to sets of control exons, of very small, small, and large amino acids encoded by two sets of SRSF2-activated and SRSF2-repressed exons identified in the K562 (1) and Huh7 (2) cell lines: (**) randomization test FDR < 0.0003. (C) Density chart of SRSF2-activated and SRSF2-repressed exons identified in K562 cells coding for very small and large amino acids: (**) K–S test < 5 × 10⁻⁶. (D) Nucleotide composition of codons encoding hydrophobic, neutral, and hydrophilic amino acids. (E) Relative frequency (%), when compared to sets of control exons, of hydrophilic, neutral, and hydrophobic amino acids encoded by TRA2-activated and TRA2-repressed exons: (**) randomization test FDR < 0.005. (F) Hydrophobic scales of TRA2-activated and TRA2-repressed exons. The green line (bottom) indicates the Mann–Whitney U test P-value < 0.05 at each amino acid position. (G) Density chart of TRA2-activated or TRA2-repressed exons coding for hydrophilic amino acids: (**) K–S test < 1 × 10⁻¹³. (H) Nucleotide composition of codons encoding polar uncharged, hydroxyl-containing, and charged amino acids. (I) Relative frequency (%), when compared to sets of control exons, of polar uncharged, hydroxyl-containing, charged, or neutral (in terms of hydropathy) amino acids encoded by two sets of SRSF3-activated and SRSF3-repressed exons identified from HepG2 (1) and GM19238 (2) cell lines: (**) randomization test FDR < 1 × 10⁻⁴. (J, left) Density chart of SRSF3-activated and SRSF3-repressed exons describing the frequencies of polar uncharged amino acids compared to all polar amino acids. (Right) Density chart of SRSF3-activated and SRSF3-repressed exons describing the frequencies of hydroxyl amino acids compared to negatively charged amino acids. Note that hydroxyl amino acids can be negatively charged after phosphorylation: (**) K–S test < 3 × 10⁻¹².


