
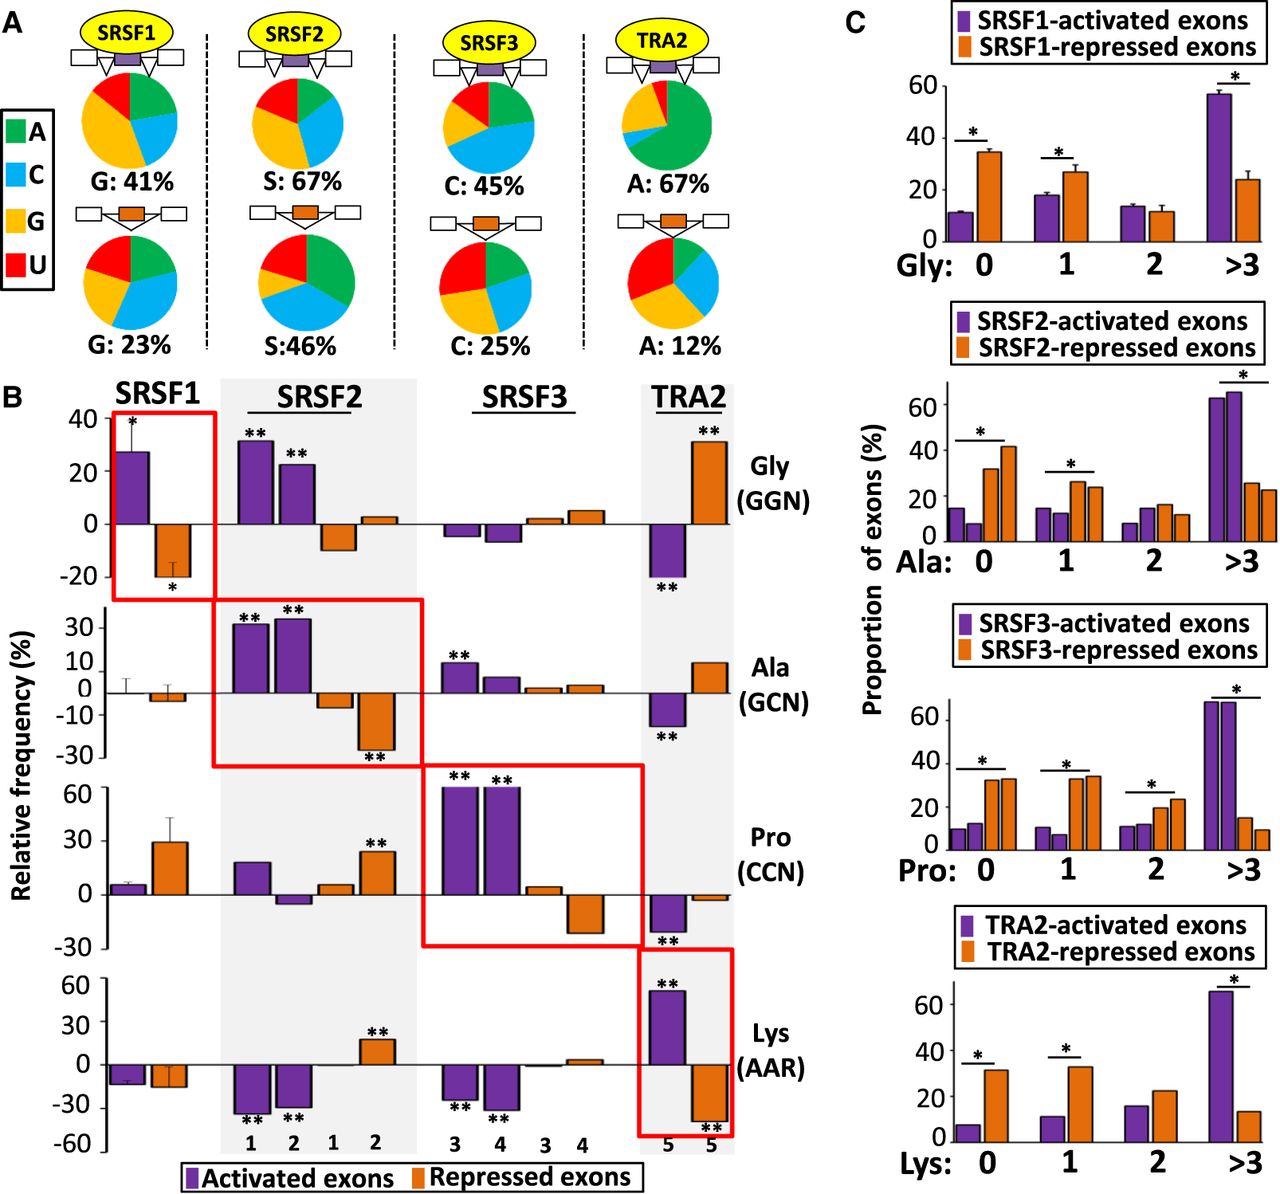
Amino acid composition bias encoded by coregulated exons. (A) Nucleotide composition of codons corresponding to amino acids more frequently encoded, when compared to sets of control exons, by SRSF1-, SRSF2-, SRSF3-, or TRA2-activated (upper) and -repressed exons (lower). (B) Relative frequency (%) compared with sets of control exons of glycine (Gly corresponding to GGN codons), alanine (Ala corresponding to GCN codons), proline (Pro corresponding to CCN codons), and lysine (Lys corresponding to AAR codons) encoded by SRSF1-, SRSF2-, SRSF3-, or TRA2-activated and -repressed exons. The average values obtained from four data sets are represented in the case of SRSF1: (*) Mann–Whitney U test P-value < 0.03. The sets of the other SRSF-regulated exons originated from K562 (1), Huh7 (2), HepG2 (3), GM19238 (4), and MDA-MB-231 (5) cell lines: (**) randomization test FDR < 0.03. (C) Proportion (%) of exons from SRSF1-, SRSF2-, SRSF3, and TRA2-regulated exons encoding for 0, 1, 2, and more than 3 Gly, Ala, Pro, or Lys amino acids, respectively. The average values obtained from four data sets are represented in the case of SRSF1. A logistic regression analysis was performed to test if the presence or absence of an amino acid at a given level was different between activated and repressed exons for a given splicing factor while accounting for cell line variations: (*) P-value < 0.05.


