
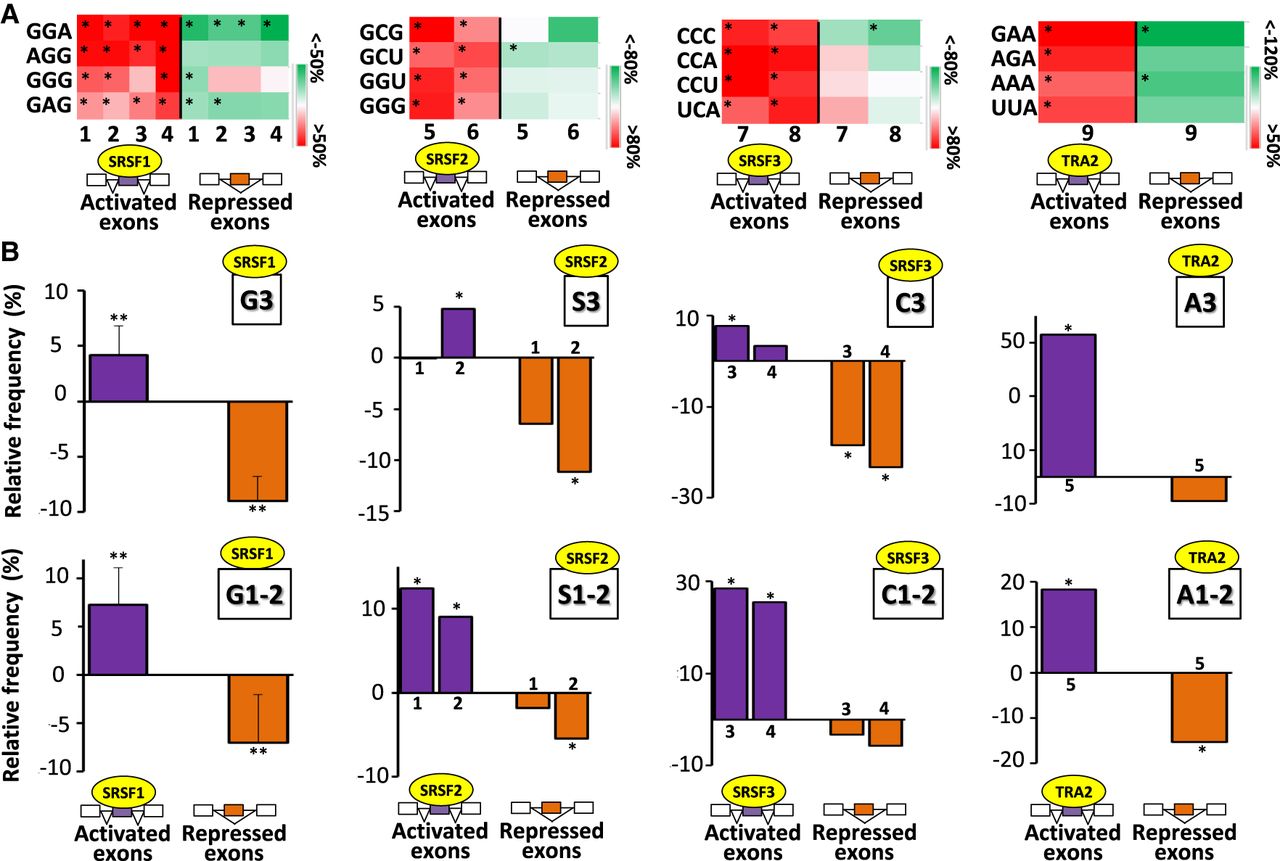
Nucleotide composition bias of codons of coregulated exons. (A) Color code of the relative frequency (%) compared with sets of control exons of some codons in SRSF-activated and SRSF-repressed exons across different cell lines: K562 (1), HepG2 (2), GM19238 (3), HeLa (4), K562 (5), Huh7 (6), HepG2 (7), GM19238 (8), and MDA-MB-231 (9). The frequency of each codon was calculated in SRSF-activated and SRSF-repressed exons and expressed as the percentage of the average frequency calculated in sets of control exons. Red and green colors indicate when the codon frequency is higher and lower, respectively, in the sets of regulated exons when compared with sets of control exons. Only some enriched codons identified in SRSF-activated exons are represented: (*) randomization test FDR < 0.05. (B) The upper panels represent the relative frequency (%) compared with sets of control exons of G (G3), S (S3), C (C3), or A (A3) nucleotides at the third codon positions in SRSF-activated and SRSF-repressed exons. The lower panels represent the relative frequency (%) compared with sets of control exons of G (G1-2), S (S1-2), C (C1-2), or A (A1-2) nucleotides at the first and second codon positions in SRSF-activated and SRSF-repressed exons. The average values obtained from four data sets are represented in the case of SRSF1: (**) Mann–Whitney U test P-value < 0.03. The sets of the other SRSF-regulated exons originated from K562 (1), Huh7 (2), HepG2 (3), GM19238 (4), and MDA-MB-231 (5) cell lines: (*) randomization test FDR < 0.03.


