
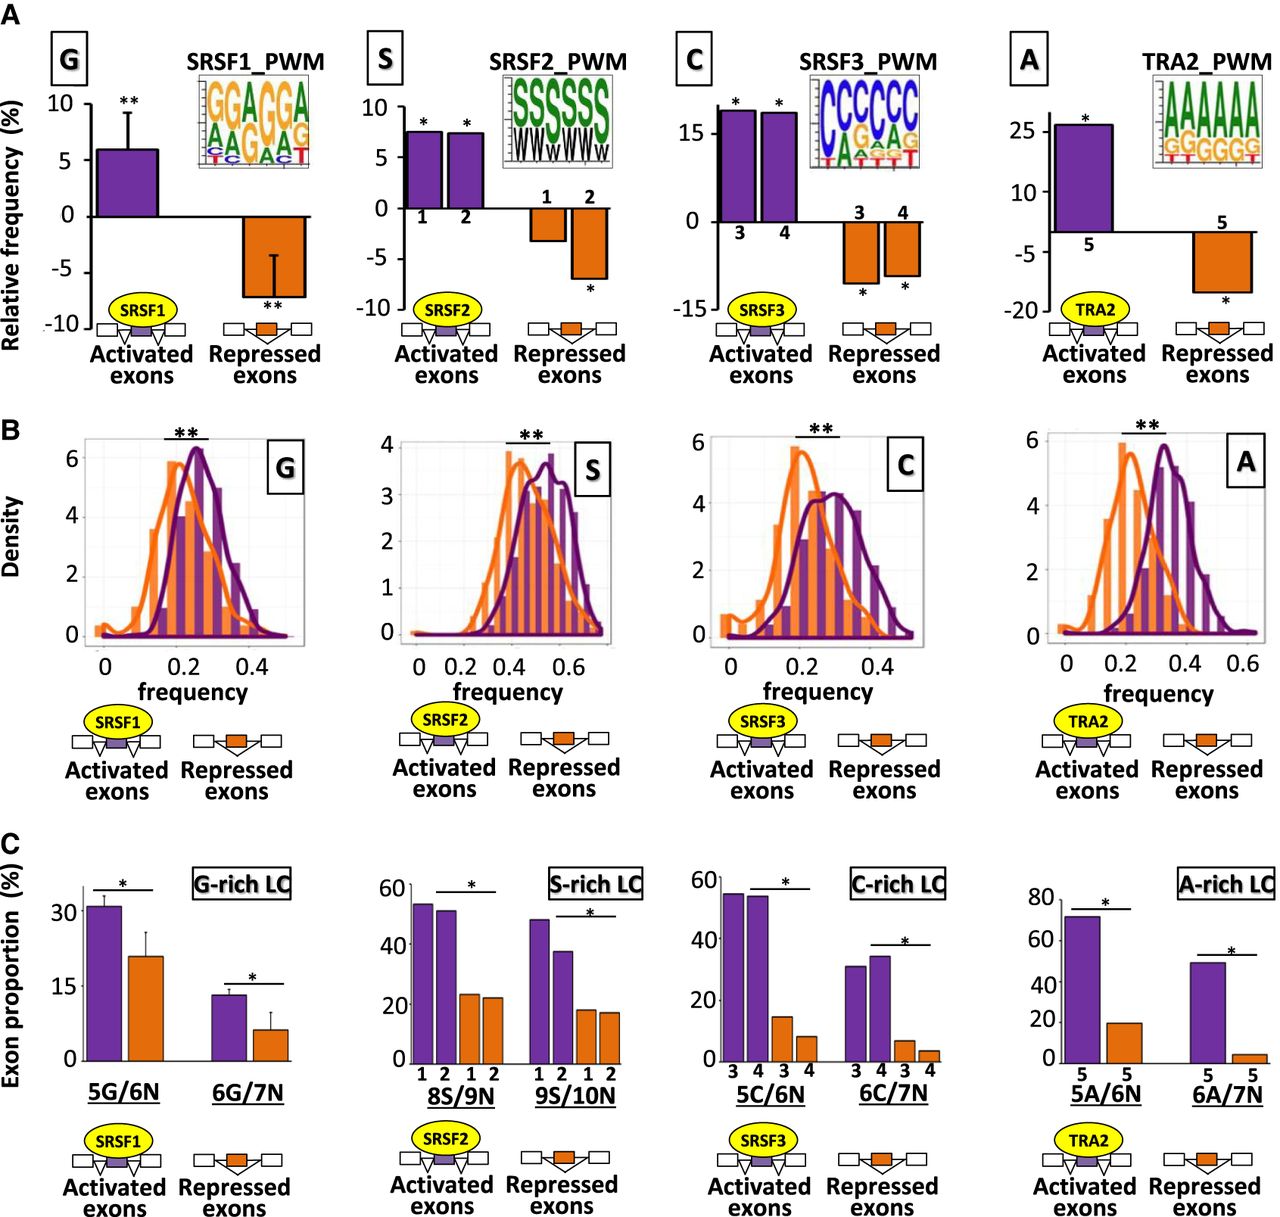
Nucleotide composition bias of coregulated exons. (A) Position weight matrices (PWM) using the 10 most enriched hexanucleotides in SRSF1-, SRSF2-, SRFS3-, or TRA2-activated exons. The histograms represent the relative frequency (%) when compared to sets of control exons of G, S, C, and A nucleotides in SRSF1-, SRSF2-, SRSF3-, and TRA2-regulated exons, respectively, identified in different cell lines. The average values obtained from four data sets are represented in the case of SRSF1: (**) Mann–Whitney U test P-value < 0.03. The sets of the other SRSF-regulated exons originated from K562 (1), Huh7 (2), HepG2 (3), GM19238 (4), and MDA-MB-231 (5) cell lines: (*) randomization test FDR < 0.03. (B) Density chart of G, S, C, and A nucleotides in SRSF1-, SRSF2-, SRSF3-, and TRA2-regulated exons, respectively: (**) Kolmogorov–Smirnov (K–S) test < 1 × 10⁻¹³. (C) Proportion of exons containing at least one low-complexity (LC) sequence of 6, 7, 9, or 10 nt. In a sliding window of N nucleotides, the number of the same nucleotide (G, S, C, or A) must be equal to or greater than (N-1). The x-axis is labeled to indicate the number of single nucleotides identified in a given window. For example, “5G/6N” means that a sequence of 6 consecutive nucleotides (6N) is composed of at least 5 Gs (5G). The average values obtained from four data sets are represented in the case of SRSF1. The sets of the other SRSF-regulated exons originated from K562 (1), Huh7 (2), HepG2 (3), GM19238 (4), and MDA-MB-231 (5) cell lines. A logistic regression analysis was performed to test if the presence of low-complexity sequences was different between activated and repressed exons by a given splicing factor while accounting for cell line variations: (*) P-value < 3 × 10⁻⁷.


