
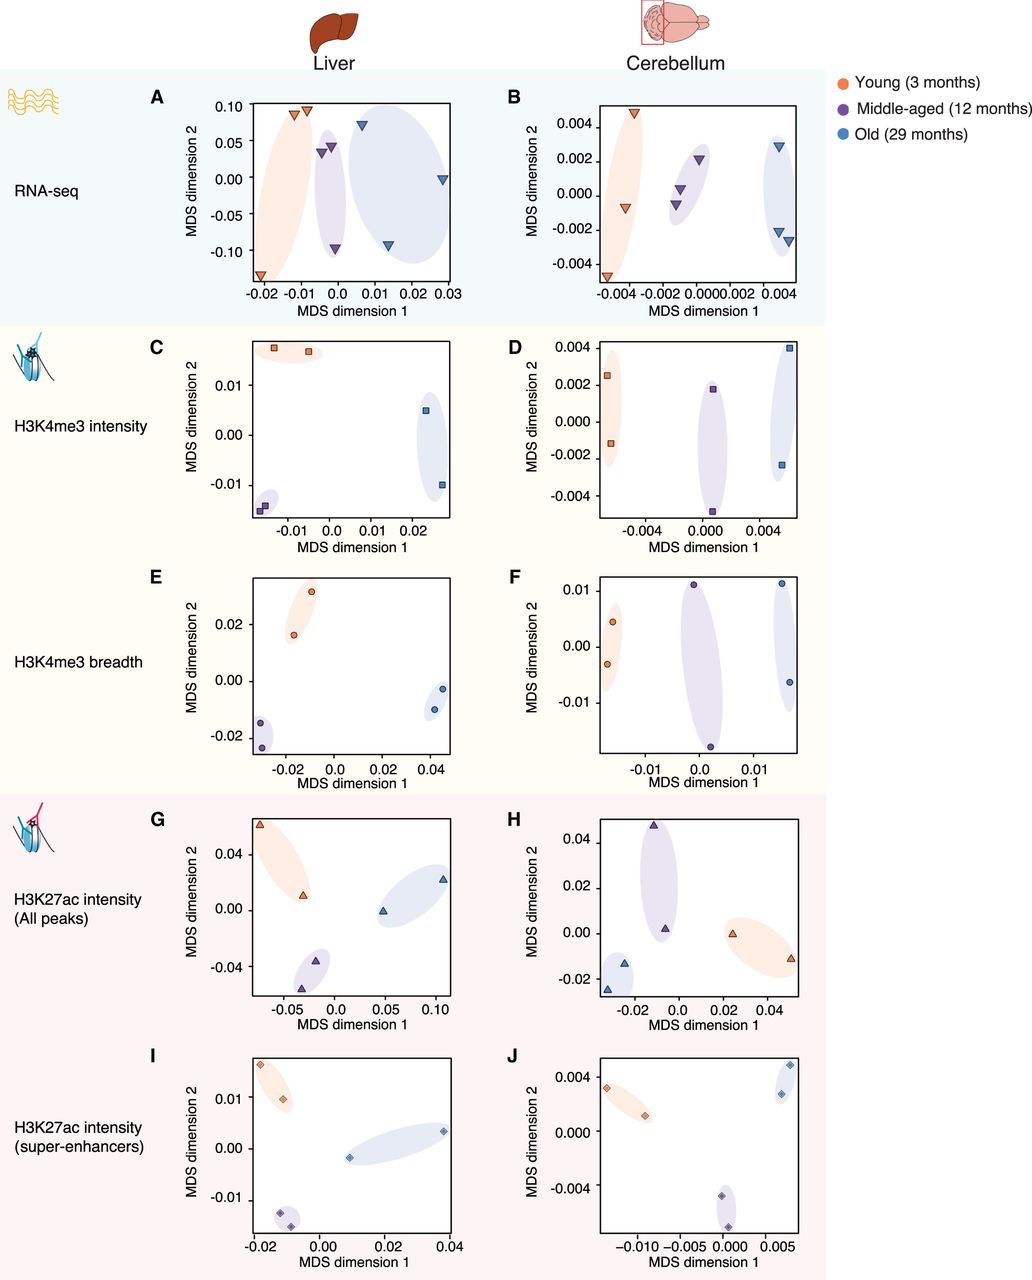
Figure 2.
Separation of samples across tissues and cell types as a function of age. Multidimensional scaling analysis results across samples derived from specific tissues, liver and cerebellum, based on RNA expression (A,B), H3K4me3 peak intensity (C,D), H3K4me3 peak breadth (E,F), H3K27ac peak intensity (all peaks: G,H; super-enhancers only: I,J). For RNA-seq data, the input was log2-transformed DESeq2 1.6.3 normalized counts. For chromatin marks, the most intense or broadest peak associated with a gene was used when more than one peak was present, and the log2-transformed normalized intensity or breadth was used as input.


