
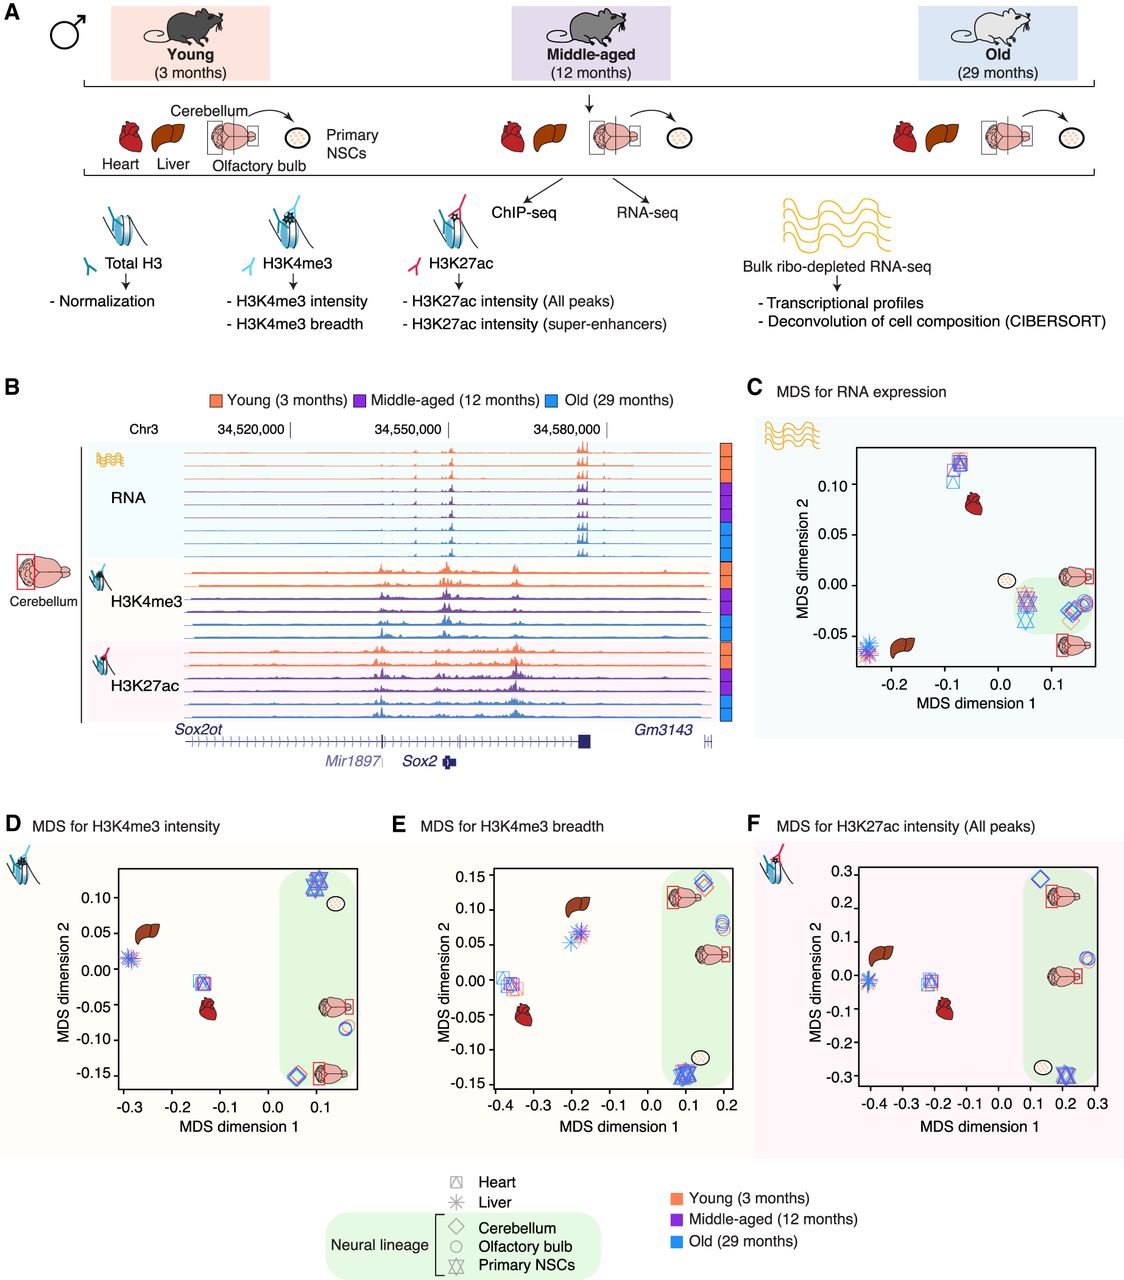
A genome-wide epigenomic and transcriptomic landscape in four tissues and one cell type during mouse aging. (A) Experimental setup (see Supplemental Table S1). (B) Example genome browser region showing tracks of data sets in cerebellum tissue at different ages. (Chr) Chromosome. (C–F) Multidimensional scaling analysis results across data sets based on RNA expression (C), H3K4me3 peak intensity (D), H3K4me3 peak breadth (E), or H3K27ac peak intensity at all peaks (F). For RNA-seq data, the input was a matrix of log2-transformed DESeq2 1.6.3 normalized counts. For chromatin marks, the most intense or broadest peak associated with a gene was used when more than one peak was present, and the log2-transformed DESeq2 1.6.3 normalized intensity or breadth was used as input.


