
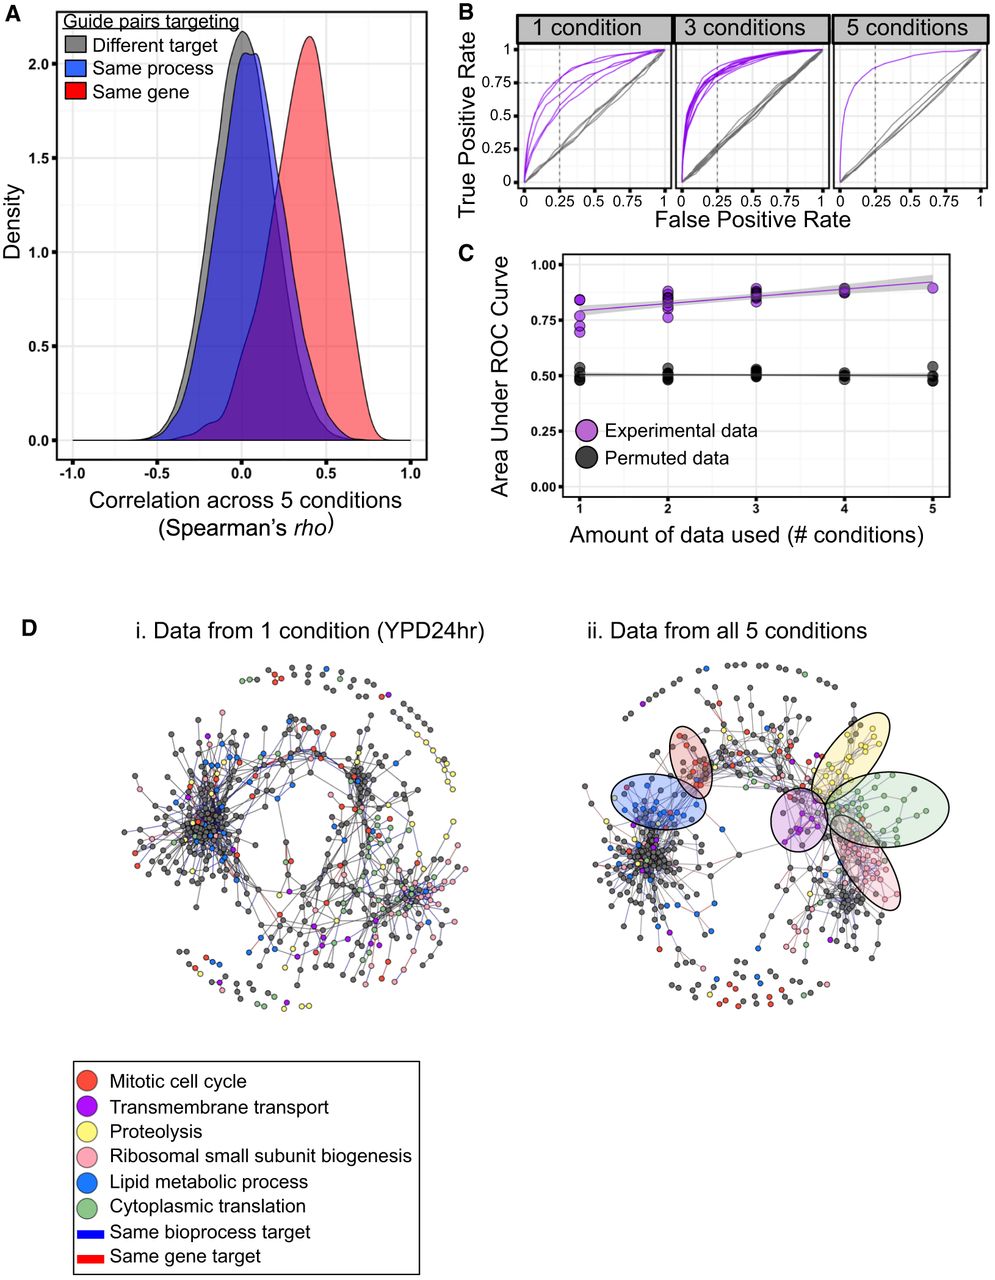
Screening in multiple conditions improves functional classification. (A) Density distributions depicting GI profile similarity of pairs of guides targeting the same gene (n = 422), targeting the same bioprocess (n = 36,029), or having different gene and bioprocess targets (n = 239,202). (B) Receiver operating characteristic (ROC) curves depicting true-positive and false-positive rates when predicting whether a starting pool guide pair targets the same gene based on GI profile similarity using different thresholds of Spearman's rho. Analysis was performed on all possible subsets of the data set for one and three conditions. Experimental data are purple; permuted data, gray. (C) The area under the ROC curves from B. (D) Network diagrams built from data from one condition (YPD24hr; i) or from the entire data set (ii). Nodes represent starting pool guides and are colored by bioprocess of target gene (for bioprocesses where a region of enrichment in the network was detected). Edges link nodes with similar GI profiles and are colored by whether the guide pair targets the same gene (red) or same bioprocess (blue).


