
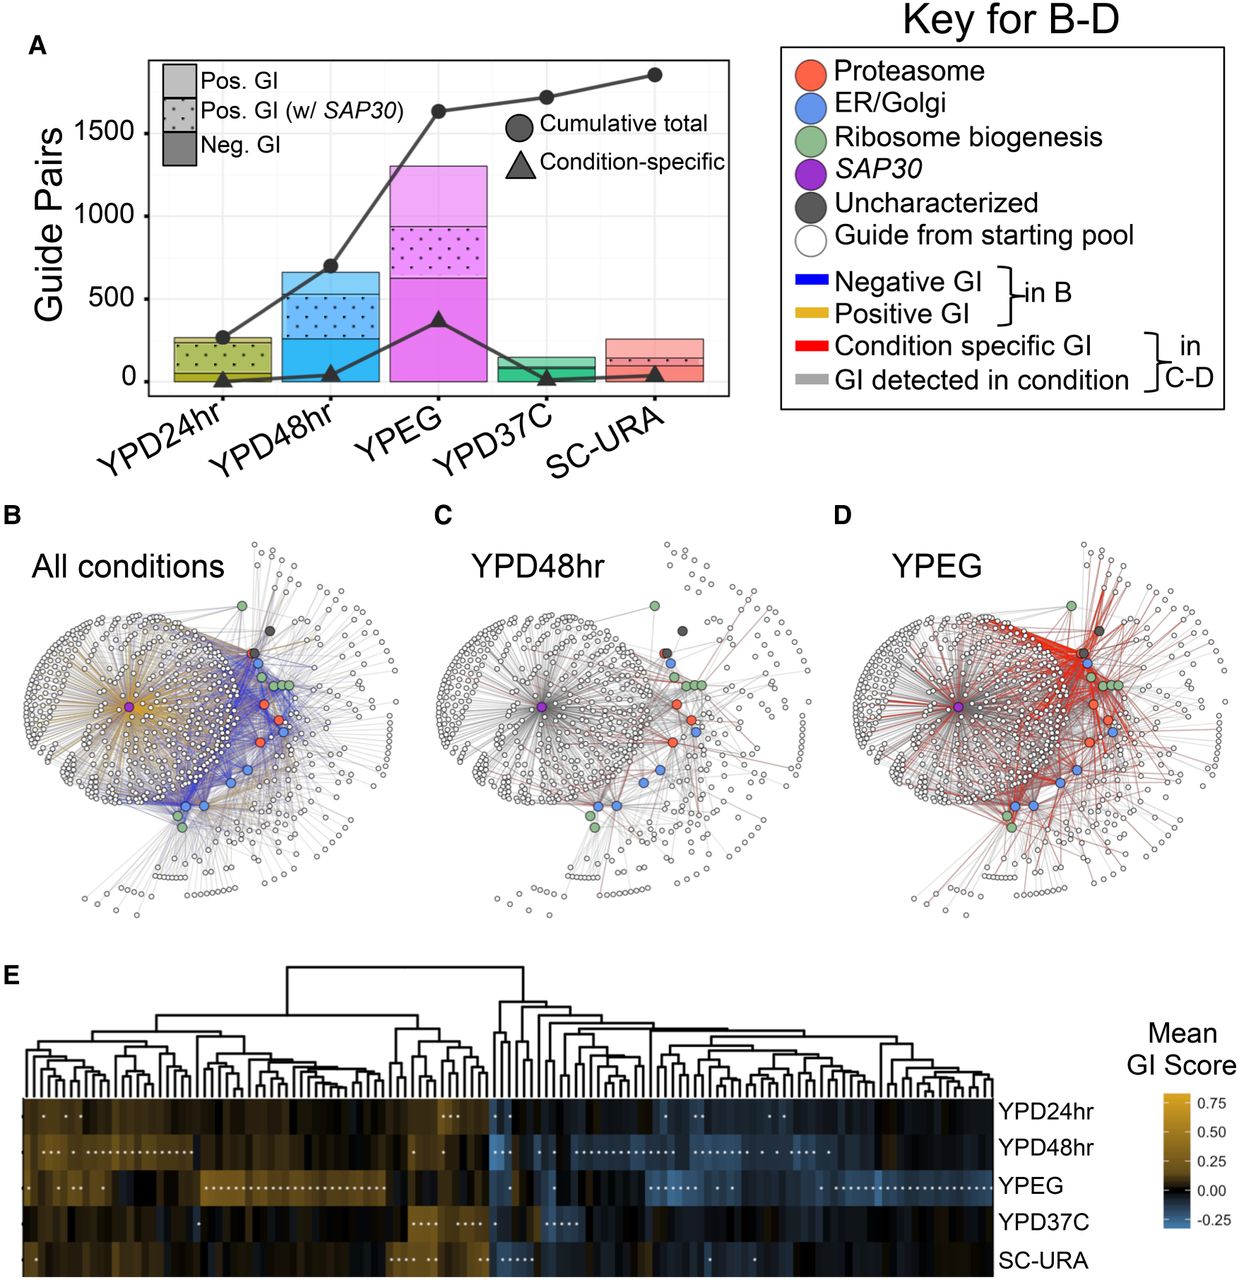
Condition-specific versus condition-independent GIs detected via CRISPRiSeq in five conditions. (A) Bar plot depicting number of significant GIs detected between guide pairs in each of five growth conditions tested. Negative and positive GIs are distinguished by shading, and positive interactions with SAP30 have a dotted pattern. Lines indicate the cumulative total of unique interactions (circles) and condition-specific interactions (triangles). (B–D) Network diagrams of significant interactions measured in at least one condition (B), YPD media with a 48-h transfer time (C) or YP + ethanol + glycerol media (D). Nodes represent guides; query guides are colored by their target's biological process. In B, blue edges are negative interactions; gold are positive. In C,D, gray edges are interactions detected in the condition; red are condition-specific. (E) Heatmap depicting mean GI score across three to 10 replicate strains for gene pairs passing significance in at least one condition (95% CI nonoverlapping with absolute z-score of one; denoted with asterisk). For gene pair labels, see Supplemental Figure S8.


