
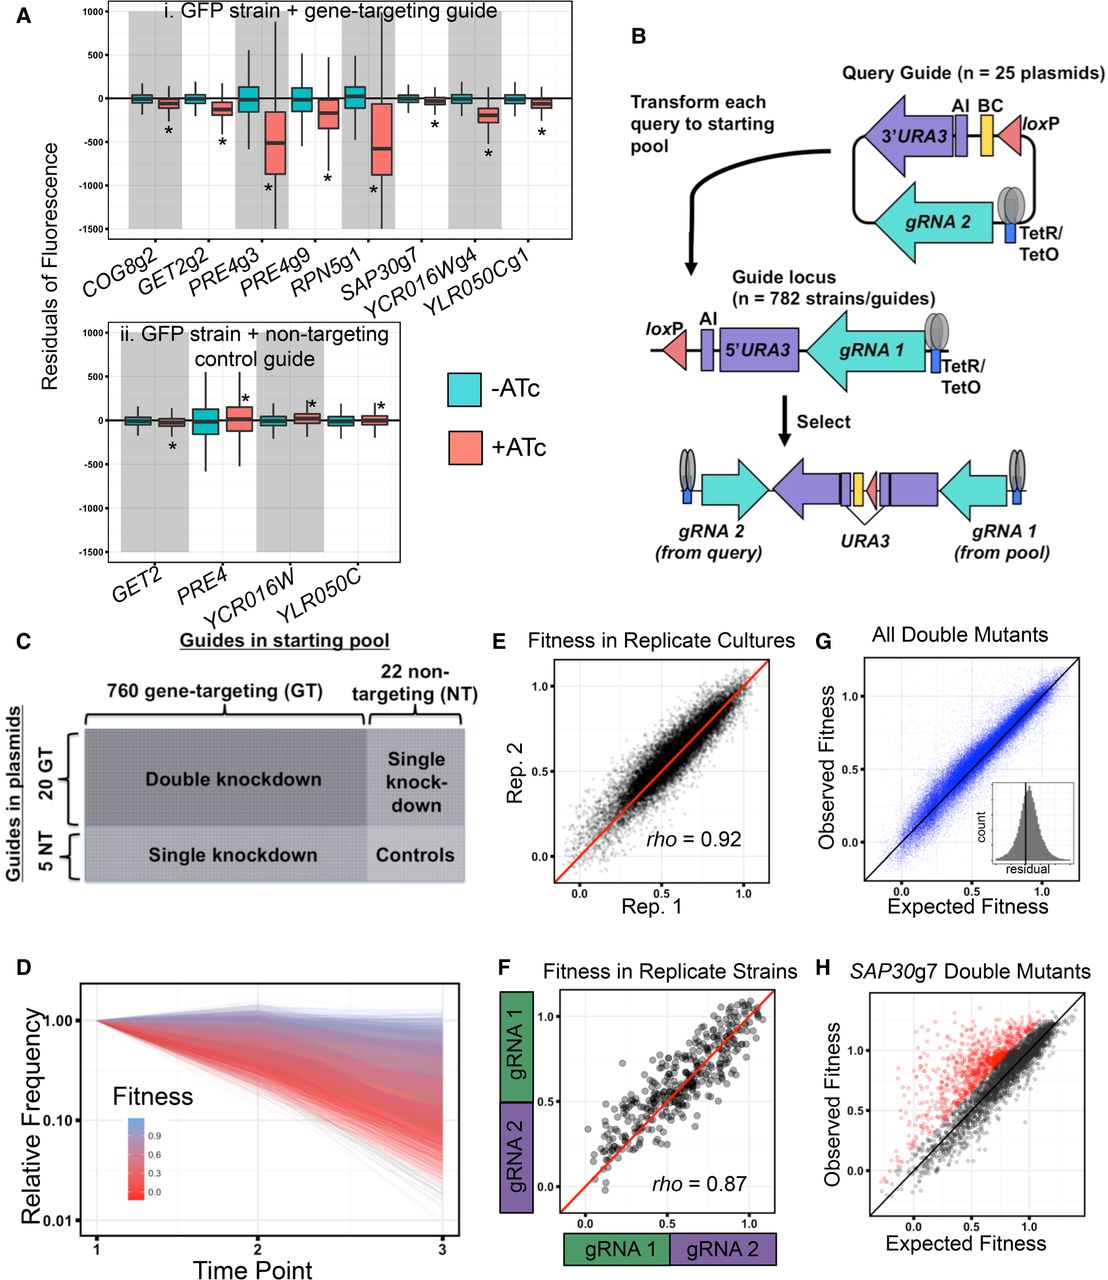
Rapid double CRISPRi strain generation and parallel fitness measurement of approximately 17,000 mutants. (A) Boxplots depicting the distributions of residuals for GFP-tagged strains carrying either a gene-targeting (i), or nontargeting control (ii) CRISPRi plasmid and grown for 4 h in inducing (+ATc; red) or noninducing (−ATc; turquoise) conditions. Residuals were calculated from a loess regression fit to the uninduced sample (for details, see Methods). Asterisks indicate significant changes in distributions upon induction with ATc (P < 10−8 by Student's t-test). (B) Constructs used during the generation of double CRISPRi strains via transformation of a query plasmid into a pool of starting strains. (AI) Artificial intron; (BC) DNA barcode. (C) Guide combinations resulting in the single-, double-, and no-gene knockdown control strains generated for this study (for details, see Methods). (D) Representative normalized relative frequency trajectories from pooled fitness assay of approximately 17,000 strains in one replicate culture of YPD; time points are collected every 24 h. Trajectories are used to estimate fitness. Raw count data are derived from amplicon sequencing. (E,F) Reproducibility of fitness from pooled assay across two replicate YPD cultures with 24-h transfer time (E; approximately 17,000 strains) and replica strains carrying the same two gRNA sequences in reverse orientations (F; 78 pairs of strains in each of five conditions). Spearman's rho for each comparison is displayed. (G) Observed double-mutant fitness compared with expectation calculated using the multiplicative model. Inset is a histogram of residuals from expectation for each observed double mutant; vertical line is at x = 0. (H) Same plot as in G, but only for SAP30g7 containing double knockdowns. Red points have a z-score >2. For E–H, diagonal lines are y = x. For F–H, data are shown from all five growth conditions.


