
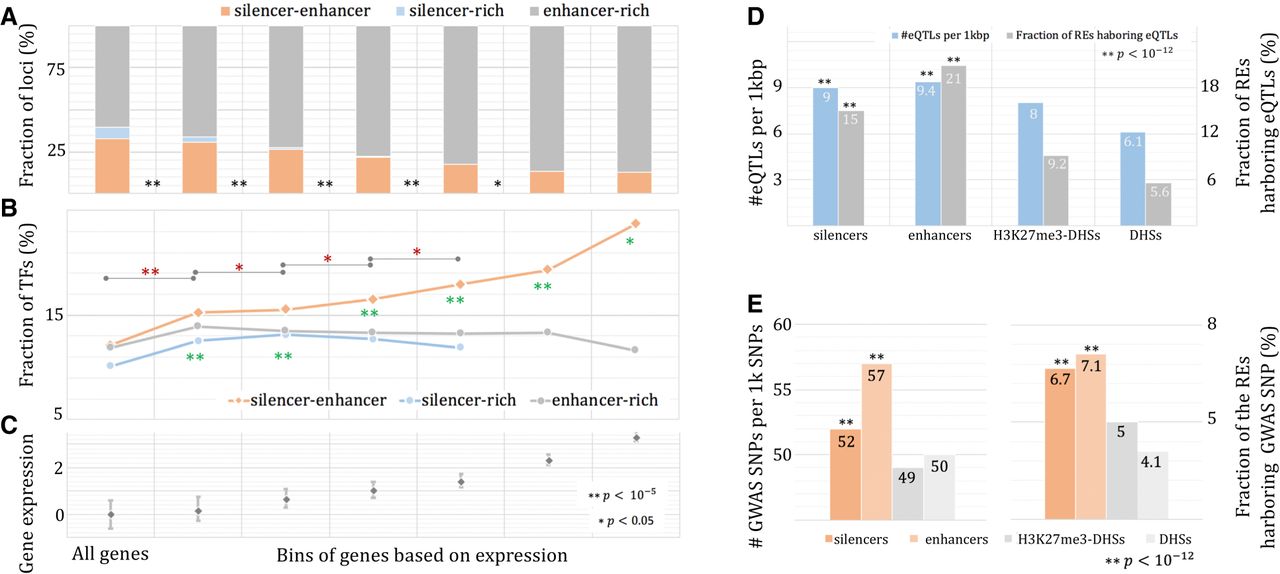
Figure 6.
Silencers in TF gene loci. Gene loci are stratified into three groups: silencer-rich loci; enhancer-rich loci; and silencer-enhancer loci (see Methods). The fraction of loci (A) and the fraction of TF genes (B) are binned by the level of gene expression (C). Green asterisks depict significant differences between silencer-enhancer loci and silencer-rich loci, while red asterisks indicate significant differences of TF fraction among silencer-enhancer loci across gene groups. Association of silencers and enhancers with eQTL SNPs (D) and GWAS SNPs (E).


