
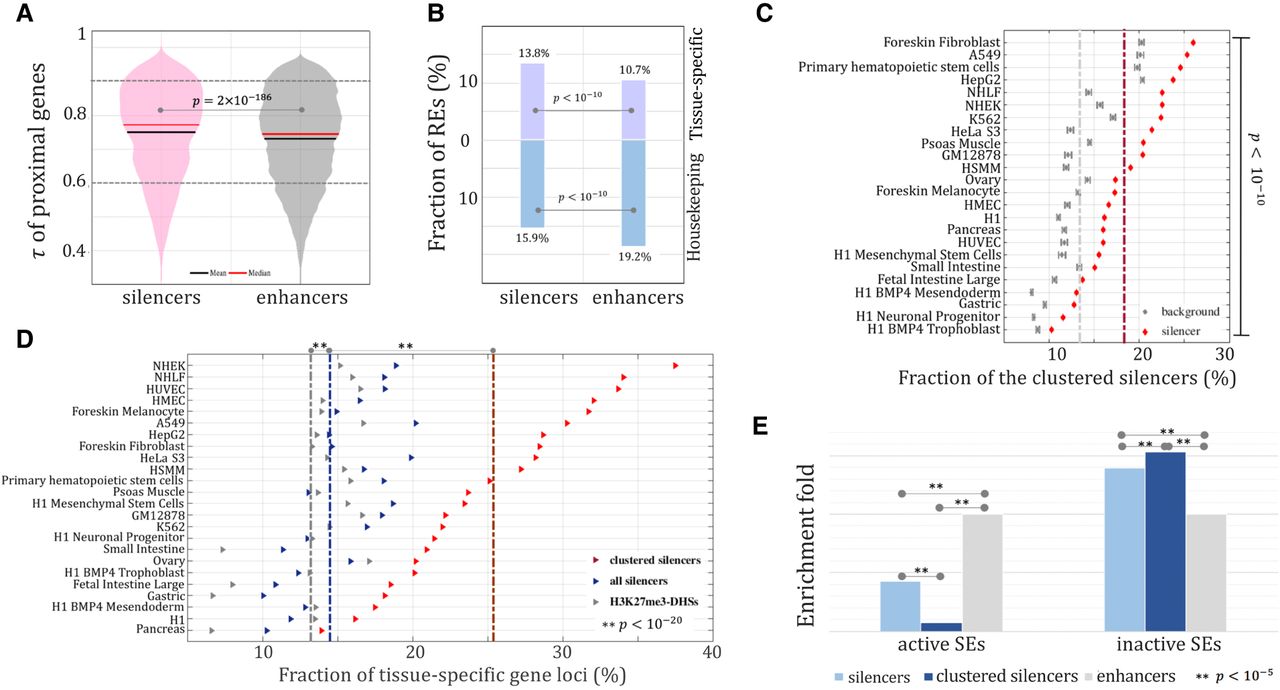
Figure 5.
Distribution of silencers. τ of genes flanking silencers and enhancers (A) and fraction of tissue-specific (τ > 0.9) and housekeeping (τ < 0.6) gene loci harboring silencers or enhancers (B). (C) Clustering of silencers. Background clustering was established using randomly selected H3K27me3-DHSs peaks matching the number of silencers. The dashed lines indicate the average fraction of clustered elements across all cell lines (red = silencers, gray = background). (D) Association of silencers and silencer clusters with tissue-specific genes. (E) Enrichment of clustered silencers in the loci of superenhancers (SEs). Enhancers were used as a background reference.


