
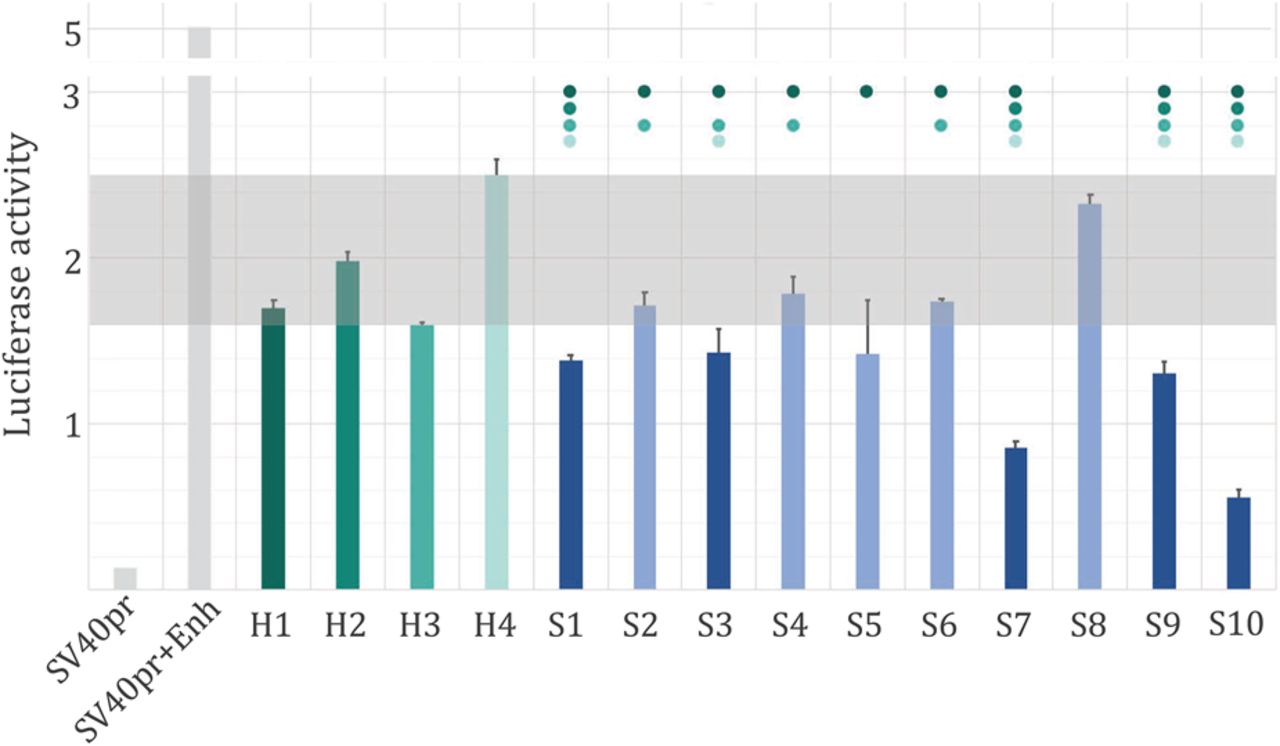
Predicted silencer activity in K562 cells. Ten predicted silencers (S1…S10) and four H3K27me3-DHS regions (H1…H4) were placed upstream of an SV40pr promoter and enhancer construct (SV40pr + Enh), and the activity of the luciferase reporter gene has been measured in K562 cells (see Methods). All predicted silencers resulted in a significant decrease of the enhancer-driven gene expression (blue bars), while five predicted silencers (represented by dark blue bars) reduced the activity of the reporter gene to levels lower than 3/4 H3K27me3-DHS regions. The dots above bars indicate that the reporter gene activity of a silencer was significantly lower (Student's t-test, P < 0.05) than that of the corresponding control with the matching color bar. The gray rectangle indicates the luciferase activity range of H1…H4.


