
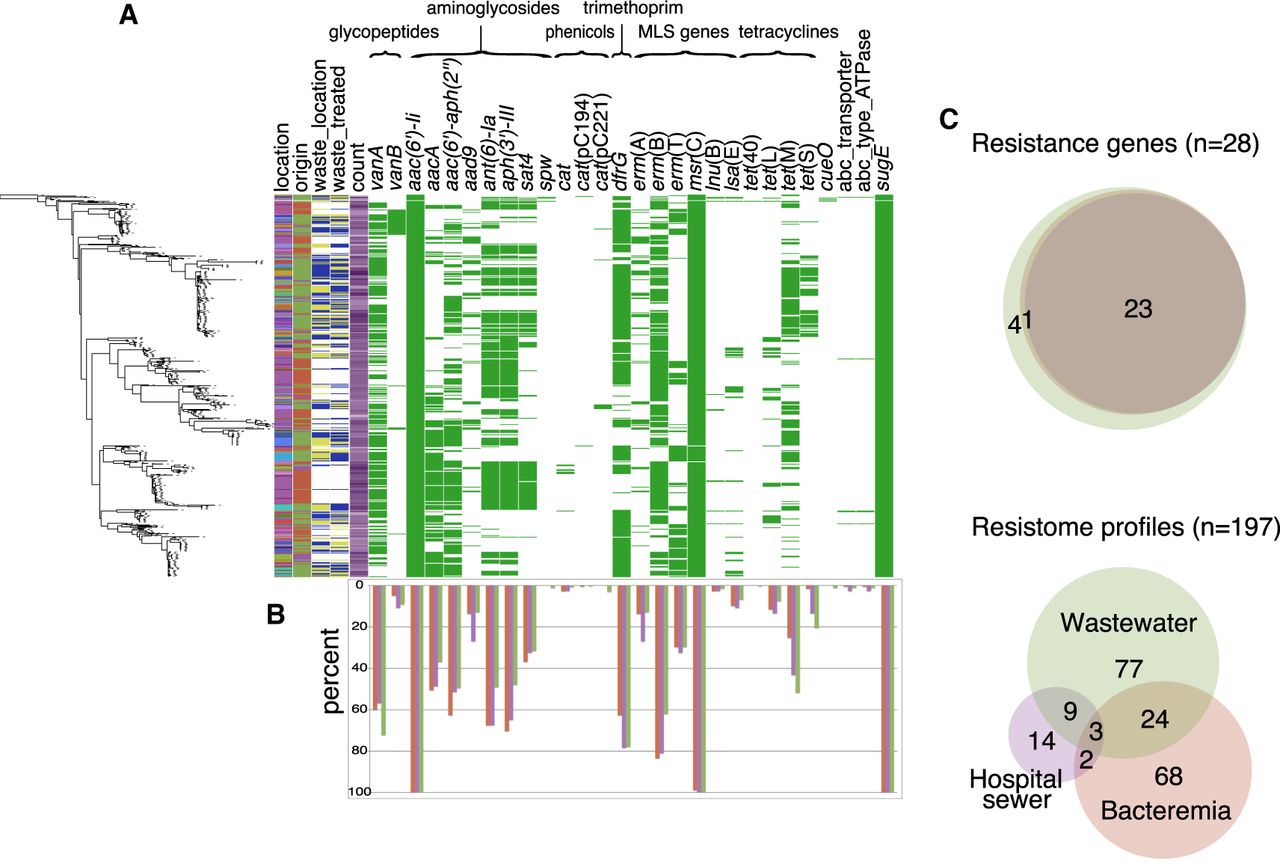
Distribution of antimicrobial resistance genes in hospital-adapted E. faecium from bloodstream infections, hospital, and municipal sewage. (A) Presence of antibiotic, metal, and biocide resistance genes grouped by antibiotic family in clade A1 E. faecium isolates shown against the core SNP maximum likelihood tree (left-hand side). Colors in left-hand columns correspond to those in Figure 3. Antimicrobial resistance gene columns: green, present; white, absent. (B) Frequency of detection of each gene in wastewater, hospital sewage, and bloodstream isolates (green: wastewater; purple: hospital sewer; red: bloodstream). (C) Venn diagrams showing the degree of overlap between individual and combined resistance gene profiles in the three reservoirs. (Upper panel) Innermost circle: bloodstream; middle circle: hospital sewer; outer circle: wastewater.


