
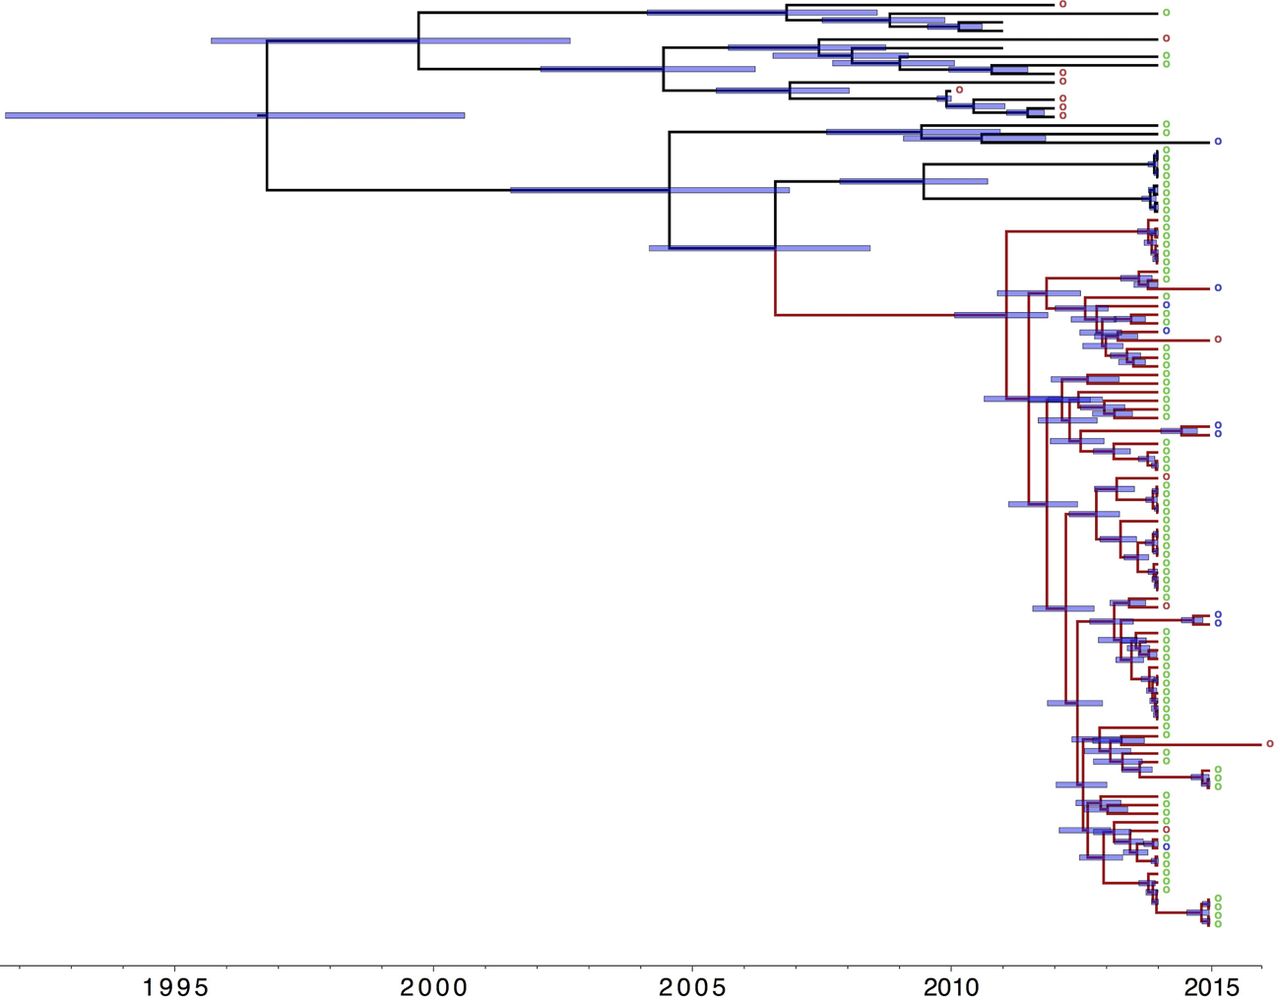
Figure 4.
Timeline of emergence of dominant E. faecium cluster. Maximum clade credibility tree of branch leading to and including the dominant cluster from BEAST analysis (n = 108 isolates). Branch in red includes all isolates of cluster (and neighboring isolates). Blue bars indicate 95% highest probability density (HPD) values. (Right) Circles denote origin of isolates. Green: wastewater; purple: CUH sewage; red: bloodstream infection. Time bar (yr) shown at the bottom.


