
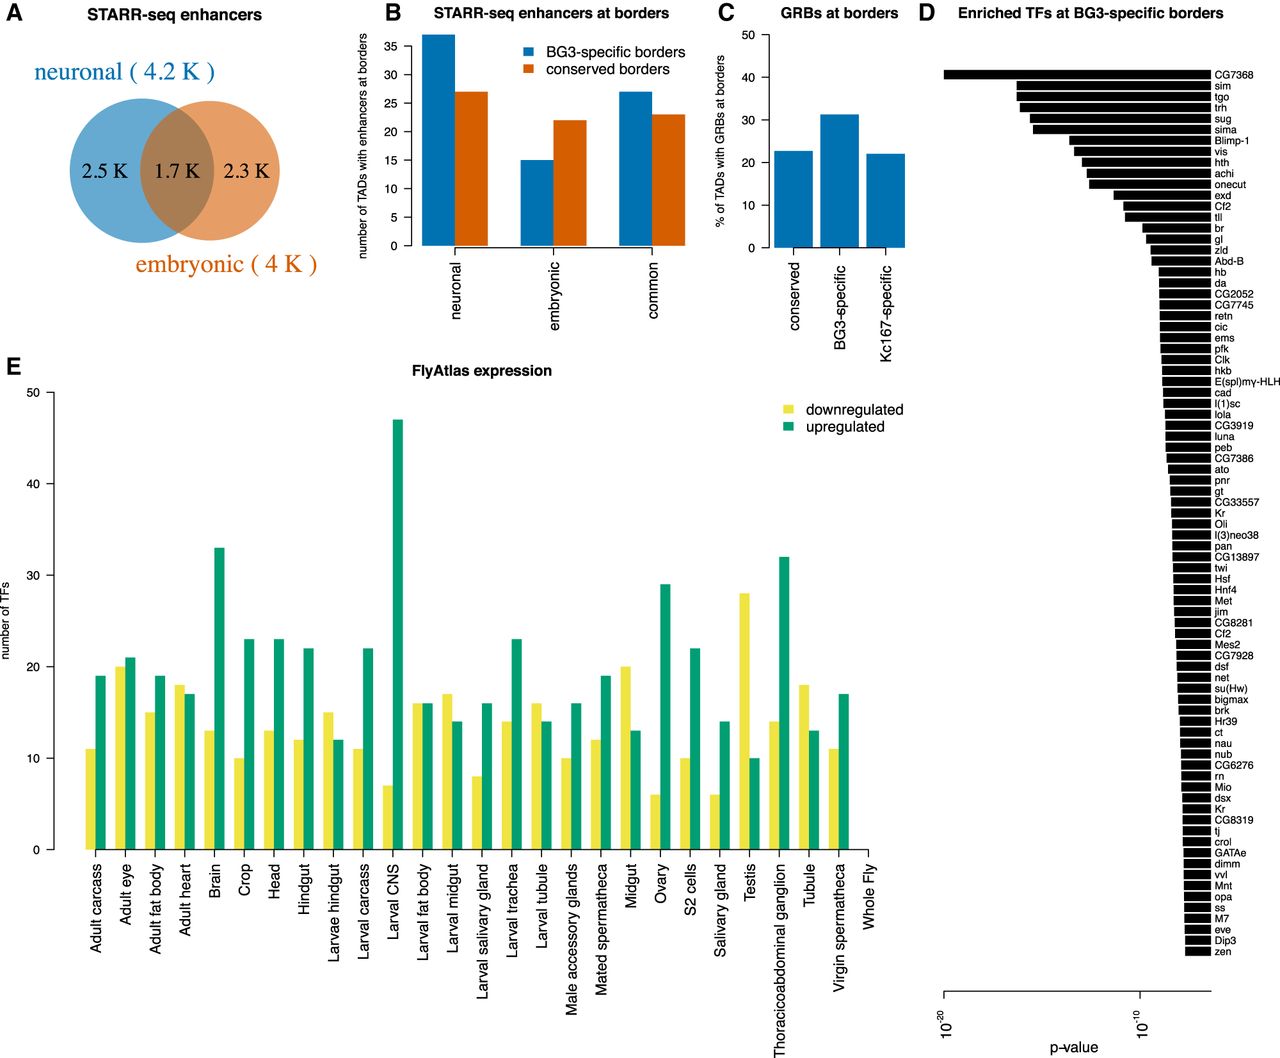
Cell-type–specific enhancers correlate with cell-type–specific TAD borders. (A) Venn diagram representing the number of enhancers in neuronal and embryonic Drosophila cells as identified by STARR-seq. Enhancers were classified as cell specific if they were annotated only in one cell type or as common if they were annotated in both cell types. (B) The number of conserved (red) or BG3-specific (blue) TAD borders that overlap with a cell-type–specific or common enhancer. Barplot showing more BG3-specific borders with neuronal enhancers than with common or embryonic enhancers, unlike conserved TAD borders. (C) The percentage of TAD borders that overlap with gene regulatory blocks (GRBs) (Harmston et al. 2017). A higher number of BG3-specific borders overlap with GRBs compared with conserved borders (Fisher's exact test P-value = 0.022) or Kc167-specific borders (Fisher's exact test P-value = 0.0021), but there is no difference between conserved borders and Kc167-specific borders (Fisher's exact test P-value = 0.86). (D) List of 81 TFs with enriched motifs at BG3-specific borders and the associated P-value (see Methods). (E) Expression of 79 of these TFs in different tissues/cells from FlyAtlas data set. Green represents up-regulated genes; yellow, down-regulated genes as indicated.


