
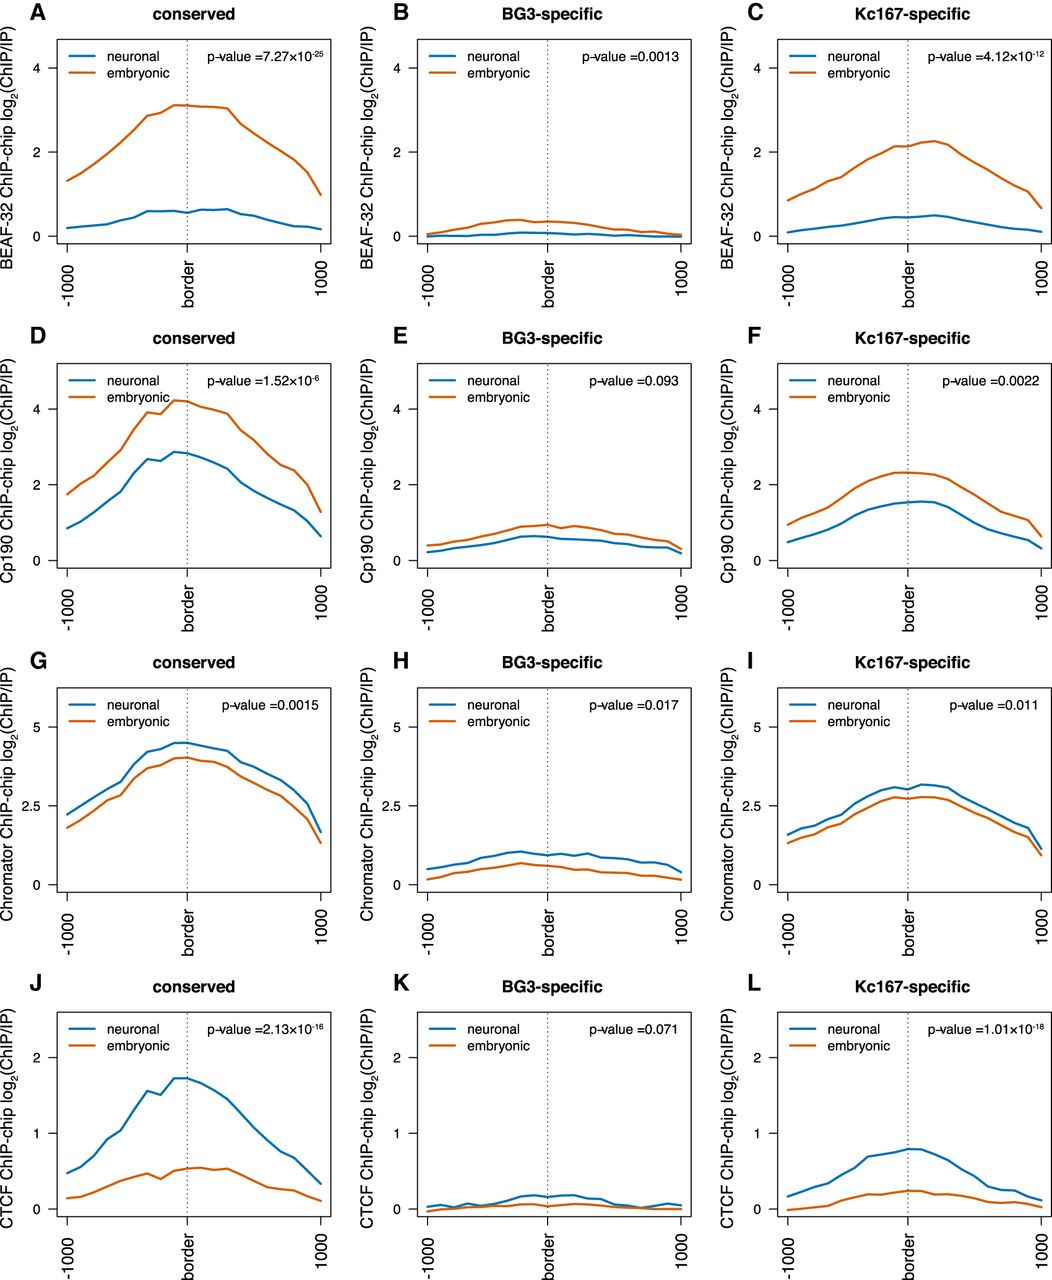
Architectural proteins differentially occupy TAD borders in a cell-type–specific manner. (A–C) Average BEAF-32 ChIP-chip signal (log2 ChIP/input) at three different TAD border classes (conserved, BG3-specific, and Kc167-specific). The red line represents data from embryonic cells; the blue, from neuronal-derived cells. As before, 1 kb around each border was considered while plotting the average profile. We performed a nonparametric Mann–Whitney U test considering the highest levels at each TAD border between embryonic and neuronal cells (see P-values). (D–F) Average Cp190 ChIP-chip signal (log2 ChIP/input) at the borders of the three different TAD classes. (G–I) Average Chromator ChIP-chip signal (log2 ChIP/input) at the borders of the three different TAD classes. (J–L) Average CTCF ChIP-chip signal (log2 ChIP/input) at the borders of the three different TAD classes.


