
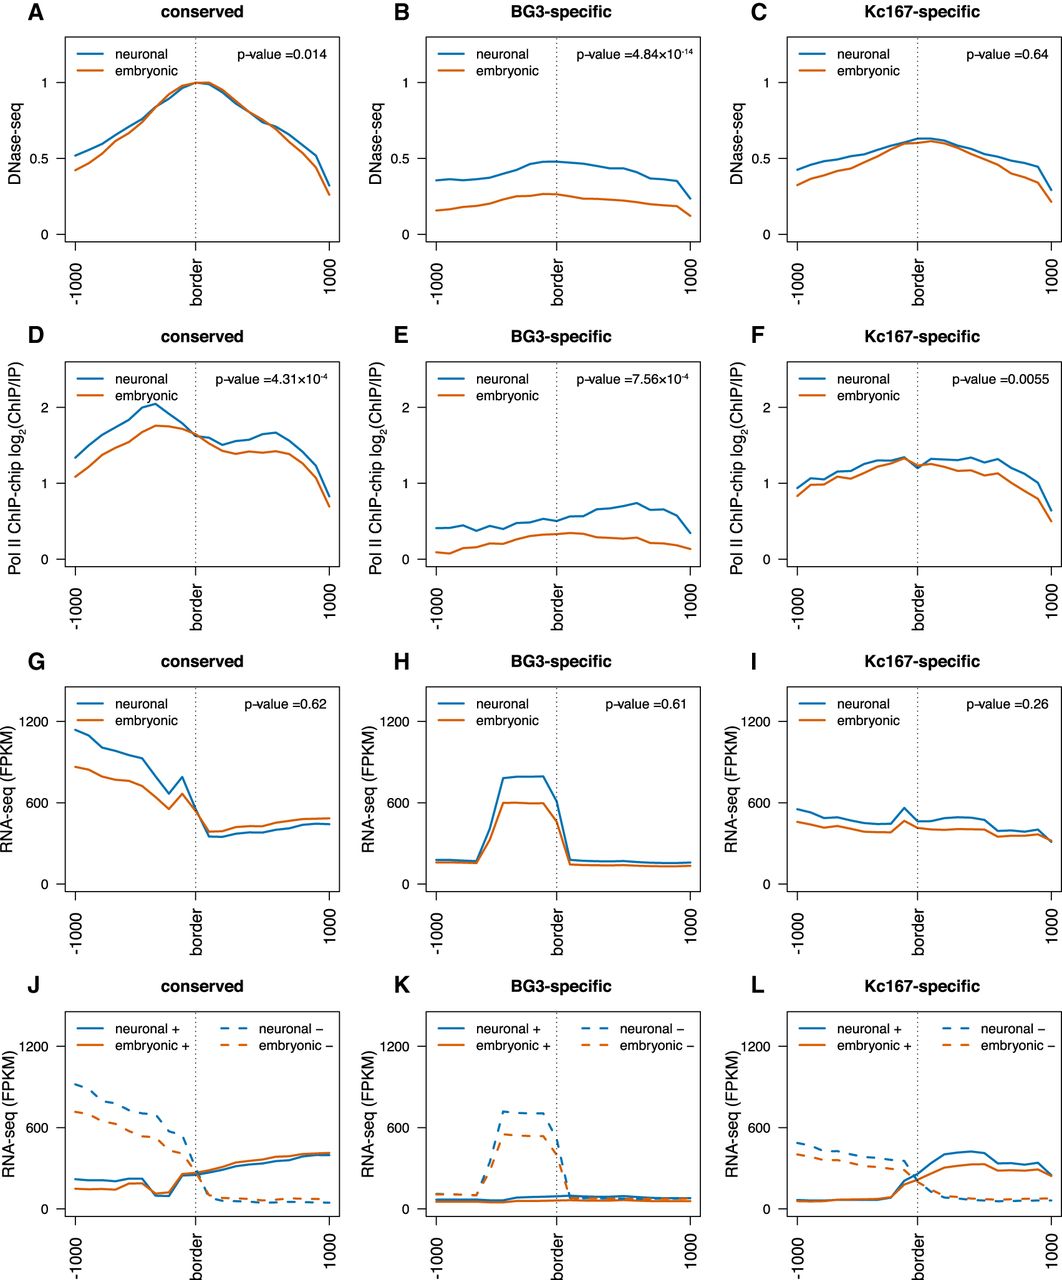
Divergent transcription and polymerase occupancy correlates with appearance of TAD borders. (A–C) DNase-seq signal at three different TAD border classes (conserved, BG3-specific, and Kc167-specific) as indicated. The red line represents data from embryonic cells (Kc167); the blue, from neuronal-derived cells (BG3). Average profile has been plotted considering 1 kb around each border. We performed a nonparametric Mann–Whitney U test considering the highest levels at each TAD border between embryonic and neuronal cells (see P-values). (D–F) Average Pol II ChIP-chip signal (log2 ChIP/input) at the borders of the three different TAD classes as indicated. (G–I) Average RNA-seq levels at the borders of the three different TAD classes as indicated. (J–L) Strand-specific average RNA-seq signal at the borders of the three different TAD classes showing strong divergent transcription at TAD borders. Solid lines represent the expression levels on the positive strand; dashed lines, the expression levels on the negative strand. For that, we mapped the expression levels of the genes to the corresponding strand using the FlyBase annotation (see Methods) (dos Santos et al. 2015).


