
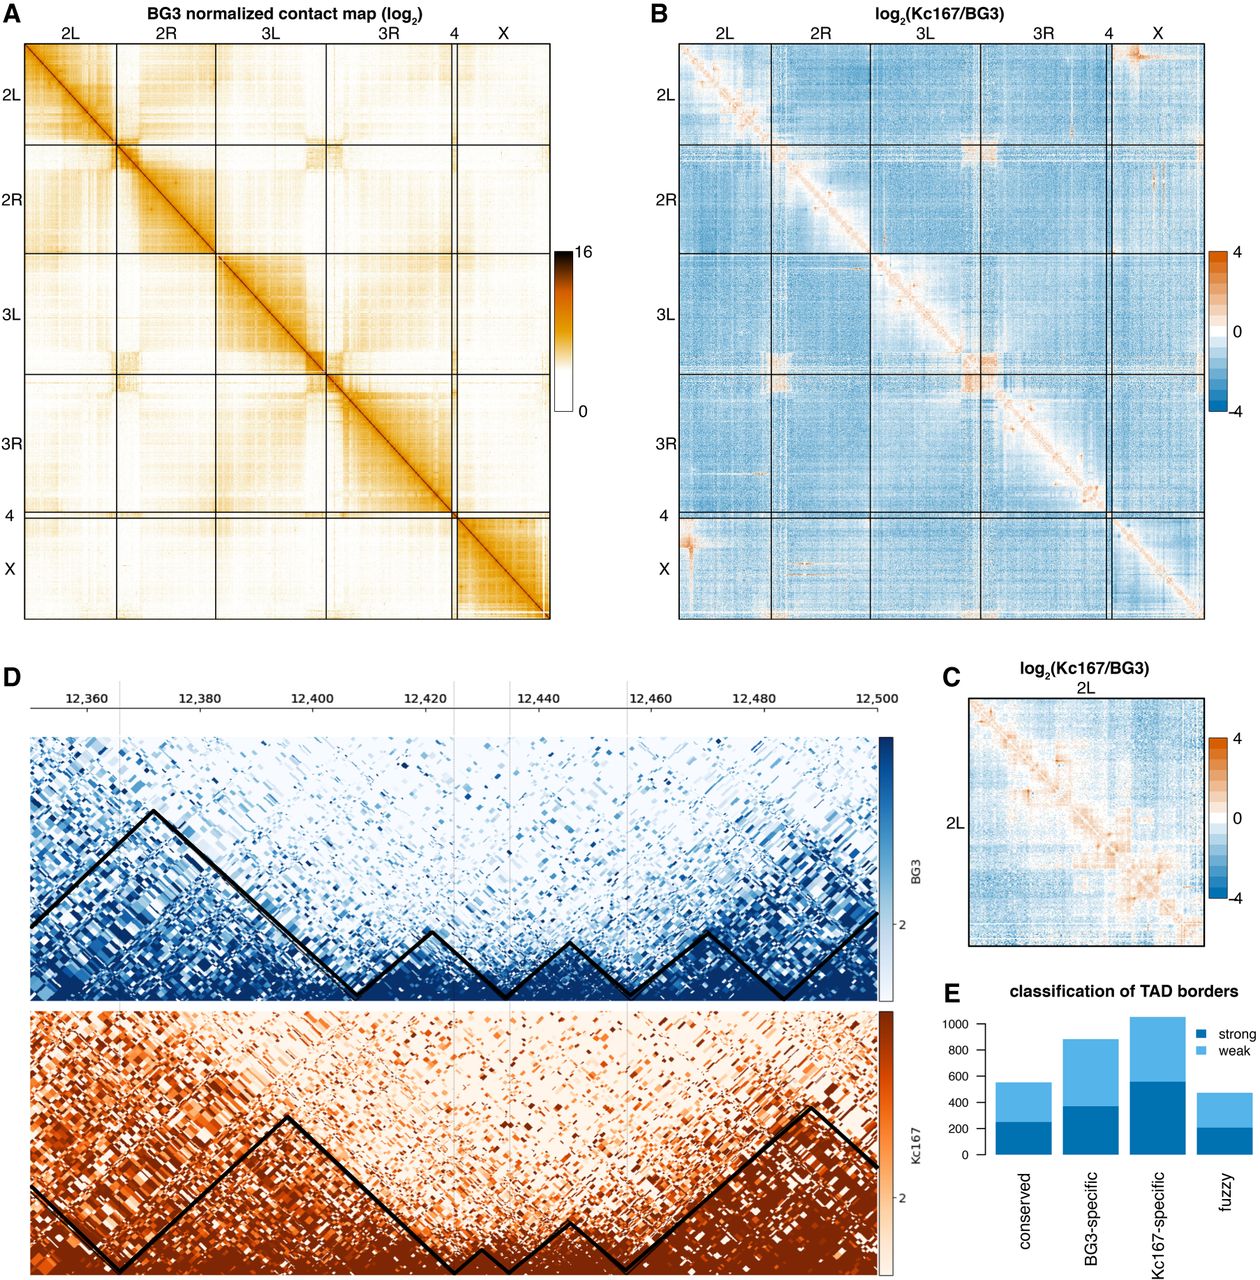
A high-resolution contact map of Drosophila BG3 cells. (A) Genome-wide normalized contact map of the Drosophila BG3 cell line at 100-kb resolution. Each element in the matrix represents the log2 of the normalized number of contacts between the two corresponding bins. (B) The log2 ratio between the normalized number of contacts in BG3 cells and Kc167 cells as indicated. (C) The log2 ratio between the normalized number of contacts in BG3 cells and Kc167 cells on Chromosome 2L. (D) Triangle view of the normalized contact map in BG3 cells at 2L:12,350,000–12,500,000 locus. Black lines demarcate the TADs. (E) Classification of TAD borders in BG3 cells as described in the main text: conserved borders, BG3-specific borders, Kc167-specific borders, and fuzzy borders. Depending on whether the TAD borders can still be detected when increasing the stringency of the TAD calling algorithm, we split each class of TAD border into two subgroups: strong borders and weak borders.


