
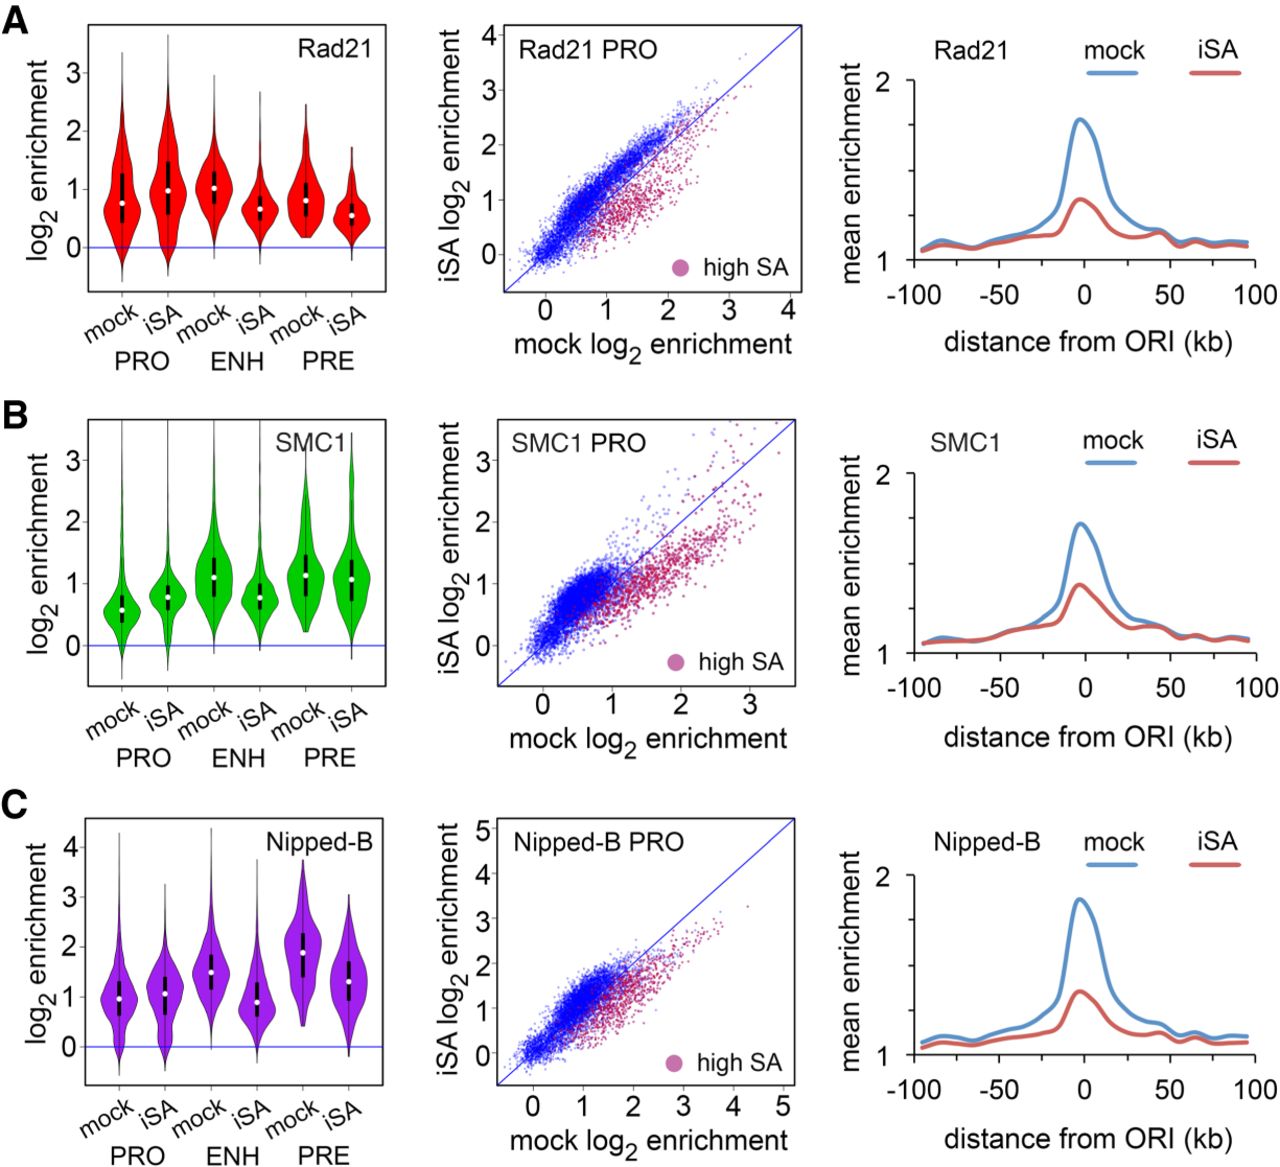
SA targets Rad21, SMC1, and Nipped-B to enhancers and origin-proximal promoters in BG3 cells. An example of SA protein depletion is in Supplemental Figure S3A. (A) Effects of SA depletion (iSA) on Rad21 localization. Violin plots (left) show the distribution of Rad21 enrichment at promoters (PRO), enhancers (ENH), and PREs (PRE) in mock control cells and cells depleted for SA. Promoter dot plots (middle) show enrichment in mock control cells versus SA-depleted cells. High SA promoters are plotted in red. Origin meta-analysis (right) shows Rad21 distribution surrounding early replication origins in mock control cells (blue) and SA-depleted (iSA) cells (red). (B) Effects of SA depletion on SMC1 location. (C) Effects of SA depletion on Nipped-B localization. Median values for all occupancy distributions and Wilcoxon P-values for mock versus SA depletion are in Supplemental Table S2. All occupancy changes are statistically significant except for SMC1 at PREs.


