
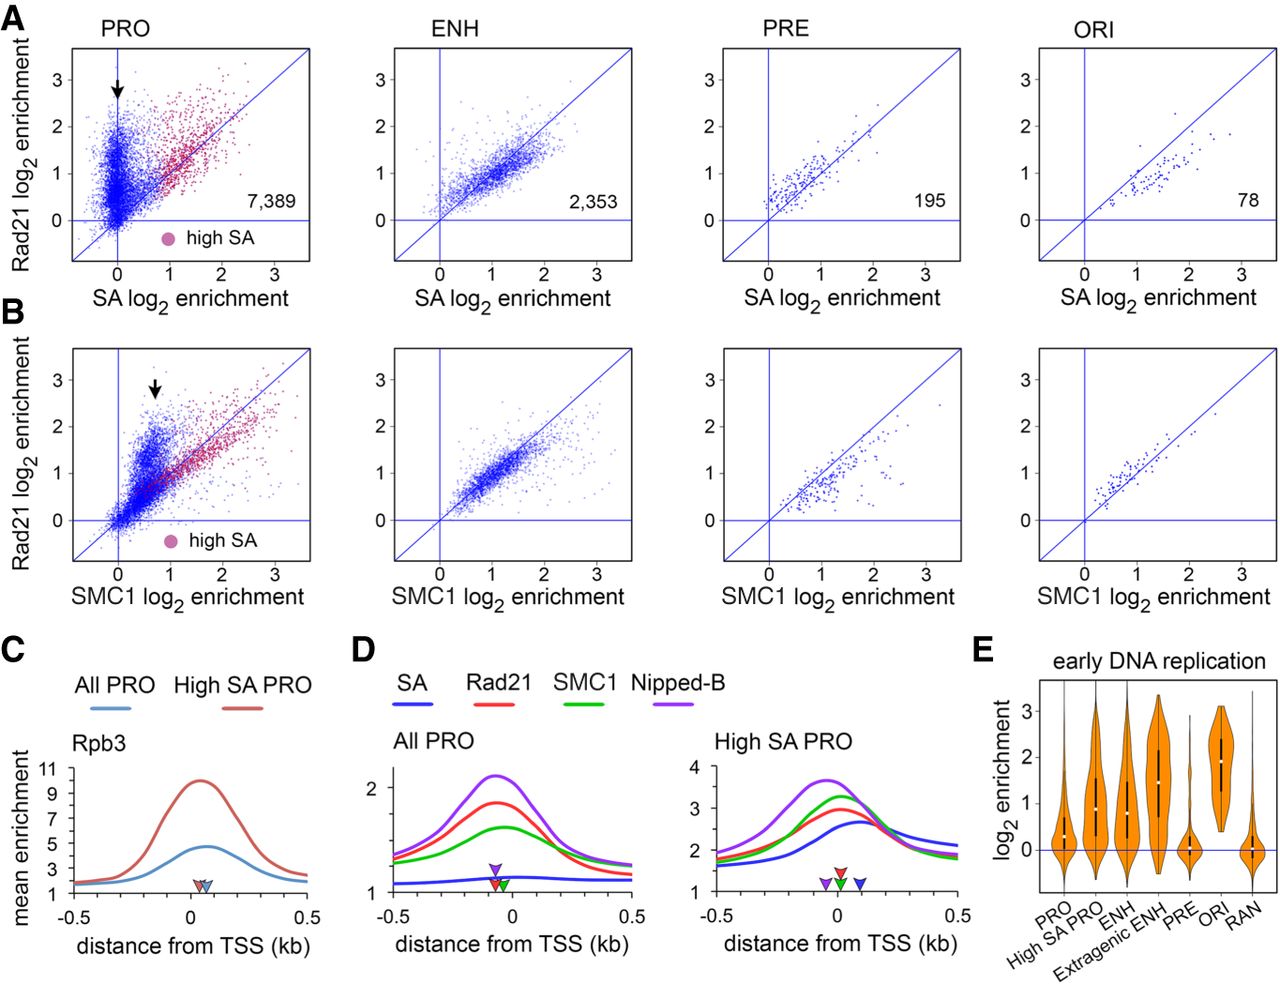
Nipped-B, Rad21, and subproportional SMC1 occupy most active promoters without SA in BG3 cells. (A) Dot plots of SA versus Rad21 enrichment at promoters (PRO), enhancers (ENH), PREs (PRE), and origin centers (ORI). The numbers of each feature type are indicated in the plots. Promoters with high SA enrichment (95th percentile over regions ≥300 bp) are plotted in red. The black arrow indicates promoters with Rad21 but no SA. (B) Dot plots of SMC1 enrichment versus Rad21 enrichment at the indicated feature types. The black arrow indicates promoters with subproportional SMC1. (C) Rpb3 (Pol II) promoter meta-analysis for active promoters (blue) and the subset occupied by SA (high SA, red). Blue and red arrowheads on the x-axis indicate the positions of peak enrichment. (D) SA (blue), Rad21 (red), SMC1 (green), and Nipped-B (purple) promoter meta-analysis for all promoters (All PRO) and the subset occupied by SA (High SA PRO). The purple, red, green, and blue arrowheads on the x-axes indicate peak enrichment for Nipped-B, Rad21, SMC1, and SA. SA peak enrichment is indicated only for high SA promoters. (E) Violin plots showing enrichment of early replicating DNA for all active promoters (PRO), promoters occupied by SA (High SA PRO), enhancers (ENH), the subset of enhancers positioned at least 500 bp outside of a transcribed region (Extragenic ENH), PREs (PRE), centers of replication origins (ORI), and randomly positioned sequences (RAN).


