
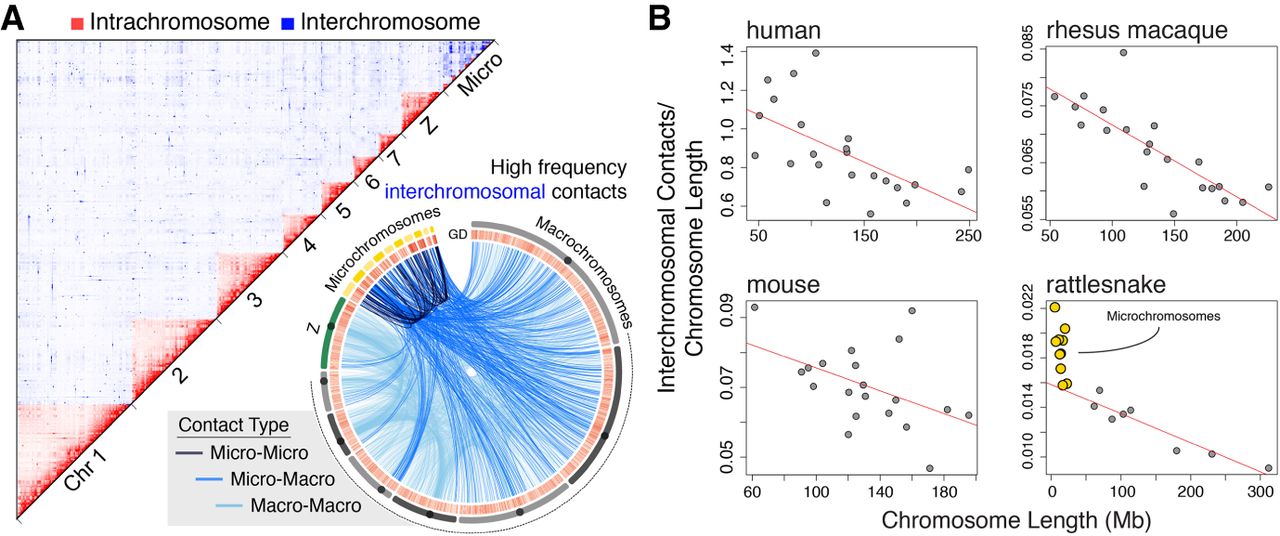
Figure 3.
Genome-wide chromosomal contacts in the rattlesnake venom gland. (A) 2D heat map of intrachromosomal (red) and interchromosomal (blue) contacts among rattlesnake chromosomes (top). Locations of interchromosomal contacts (bottom), where light blue lines are contacts between macrochromosomes, medium blue lines are micro-to-macrochromosome contacts, and dark blue lines are contacts between microchromosomes. (B) Comparison of interchromosomal contacts normalized by chromosome length versus chromosome length for different species from Hi-C data sets. Red lines depict negative linear relationships for macrochromosomes.


