
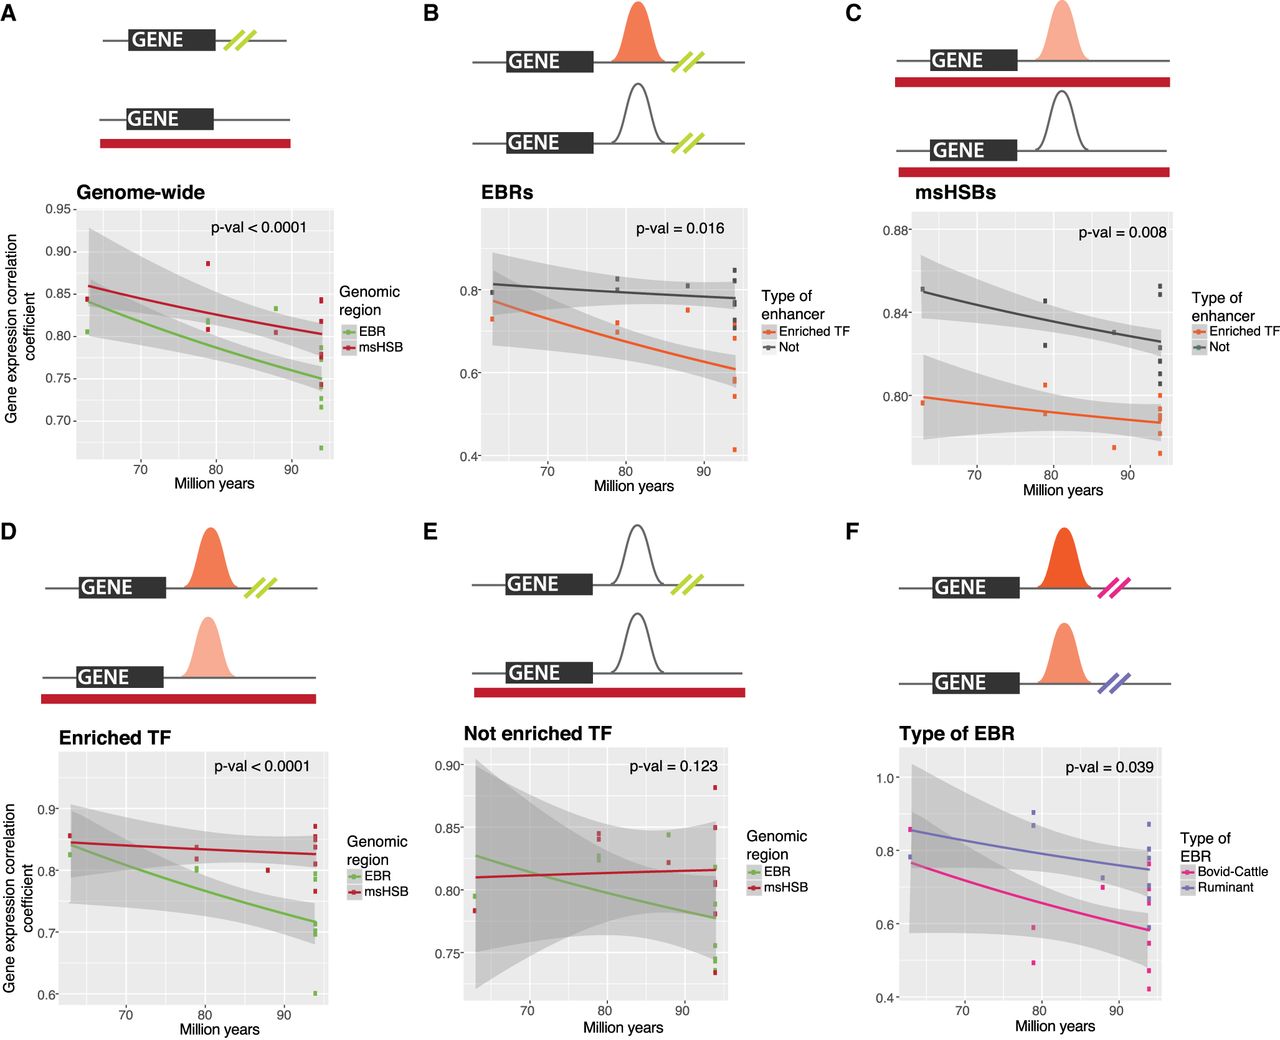
Gene expression correlation comparisons of genes in EBRs and msHSBs. (A) Pairwise correlation coefficients plotted against evolutionary distance for pairs of species with genes ±50 kbp of EBRs (olive green) and genes in msHSBs with the same distribution of mean expression levels across species (red), showing that genes in/near EBRs have more evolutionarily diverged expression patterns than genes in msHSBs. (B) Correlation coefficients of genes near EBRs with 25 TF motif enhancers (orange) compared to genes near EBRs without 25 TF motif enhancers (gray), suggesting that the 25 TF motif enhancers might contribute to the differences. (C) Correlation coefficients of genes in msHSBs with 25 TF motif enhancers (orange) compared to genes in msHSBs without 25 TF motif enhancers (gray). Genes near EBRs with 25 TF motif enhancers (D) or without 25 TF motif enhancers (E) in their regulatory regions were compared to matching genes in msHSBs, showing that the 25 TF motif enhancers in EBRs have a stronger effect on gene expression than the same type of enhancers in msHSBs. This effect was not observed for other types of enhancers. (F) Comparison between ruminant- (purple) and bovid-to-cattle lineage (pink) EBRs for expression of genes with 25 TF motif enhancers, suggesting that a higher number of motifs for the 25 TFs correlated with a more diverged gene expression. Lines correspond to linear regression trends with 95% confidence intervals in gray shading. P-values were obtained using Wilcoxon rank-sum test. Shading of the 25 TF motif enhancers represents the mean number of TF motifs in enhancers in each genomic region, ranging from a mean of 14.25 (pale orange) to 24.91 (dark orange) motifs in 25 TF motif enhancers. Additional data can be found in Supplemental Figure S6.


