
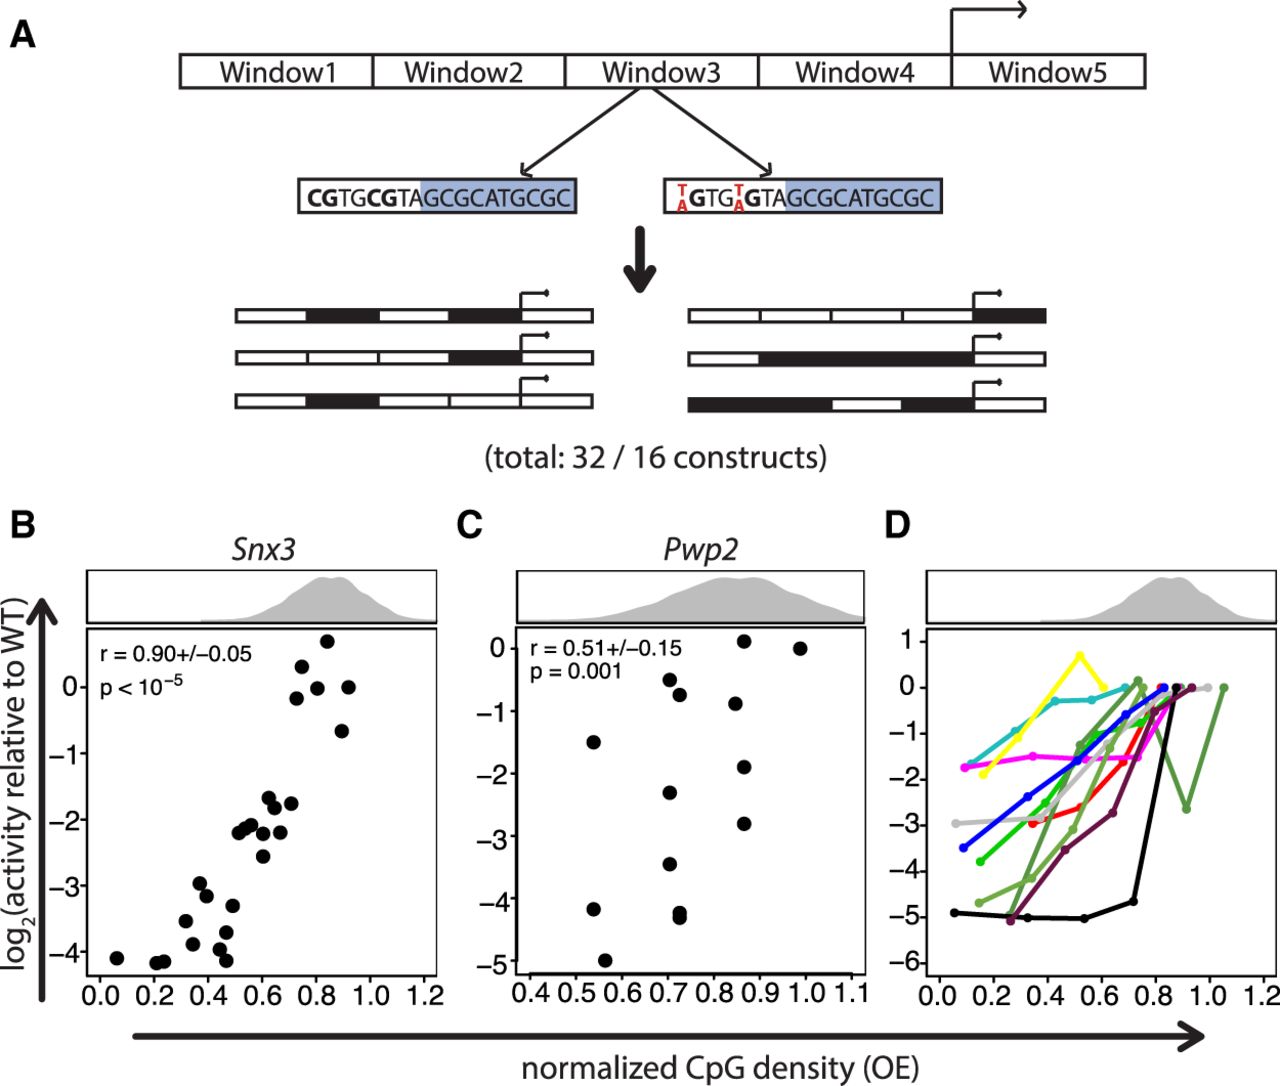
Normalized CpG density correlates with transcriptional activity. (A) Mutation strategy. Promoters were mutated in windows, in which all Cs within CpGs that were not a part of a complex motif of TFs with a ChIP-seq peak at the promoter were mutated to Ts (for Snx3) or As (for Pwp2). WT and mutant windows were assembled in all possible combinations and assayed for transcriptional activity. The windows in the Snx3 promoter had 5, 10, 6, 9, and 12 CpGs, respectively, and ranged from 50–120 bp in size. For Pwp2, windows of 70–150 bp with 8, 7, 7, and 7 CpGs, respectively, were mutated. The numbers 32 and 16 indicate the number of constructs for Snx3 and Pwp2, respectively, the large majority of which led to a transcriptional read-out. (B) Presence of CpGs positively correlates with transcriptional activity. Scatter plot of normalized CpG density versus transcriptional activity of Snx3 promoter mutants. The histogram above the scatter plot depicts the normalized CpG density distribution within promoters overlapping CGIs. The average Spearman's correlation coefficient of all three replicates (±1 SD) and its significance is indicated in the upper left part of the plot. P-values were determined based on an approximate permutation test (see Methods). (C) Same as in B for the Pwp2 promoter. Due to low coverage of BCs for this promoter series, in this case we adjusted the threshold on the minimal number of required BCs per promoter mutant to 1. (D) Positive correlation of normalized CpG density with transcriptional activity is a general feature in promoter mutant libraries. Scatter plot showing normalized CpG density versus transcriptional activity in the reporter assay for 11 promoters. Mutant promoters were generated by random mutation of Cs to As within CpGs if they were not part of complex motifs of TFs that have a ChIP-seq peak at the promoter. Different numbers of CpGs were mutated to generate five different normalized CpG densities per promoter.


