
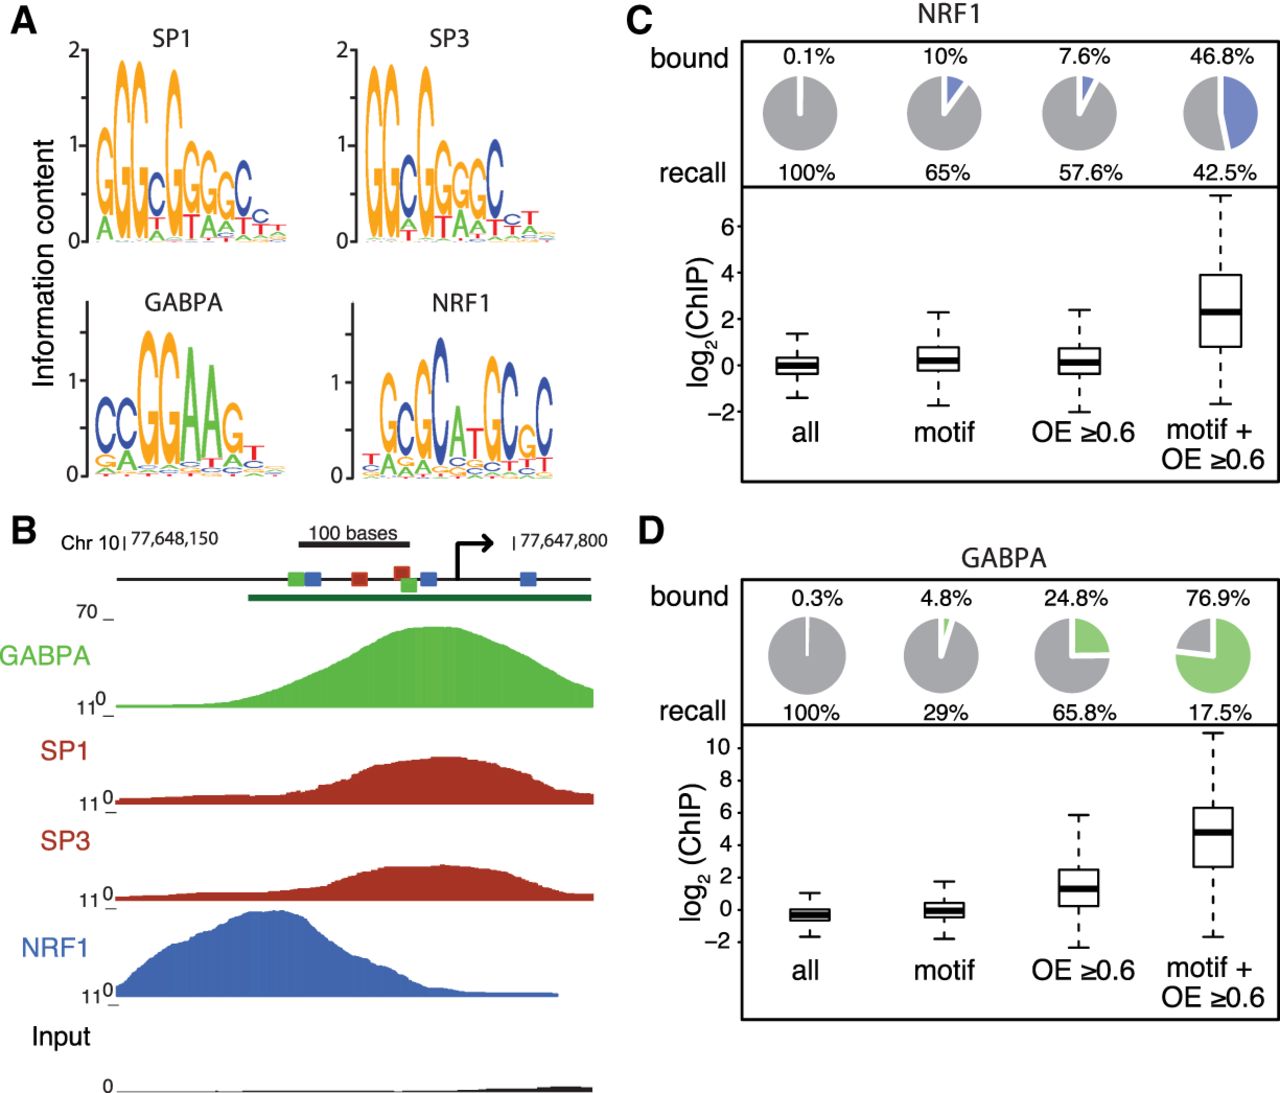
Bound TF motifs are enriched in CpG islands. (A) Position weight matrices of SP1, SP3, GABPA, and NRF1 as inferred from the respective ChIP-seq peaks. (B) Browser screenshot of SP1, SP3, GABPA, and NRF1 ChIP-seq data sets at the Pwp2 promoter. Predicted TF motifs for the respective factors are highlighted as colored squares; the green bar indicates a CpG island. (C) High CpG density and TF motif occurrence combined result in the largest enrichment of bound TF motifs. Pie charts show, for different subsets, the percentage of NRF1-bound genomic windows (600-nt tiling windows, log2 enrichment over input >2.5), with the percentage indicated above the pie chart (bound); (recall) percentage of all bound genomic windows that are part of each subset. Corresponding box plots of log2 ChIP enrichments are shown below the pie charts. (All) All windows, (motif) windows containing a motif that has a log-odds score ≥ 12 (log2 scale), (OE ≥ 0.6) windows with an OE ≥ 0.6, (motif + OE ≥ 0.6) windows with both a motif with a log-odds score ≥ 12 and an OE ≥ 0.6. (D) Same as in C for the first replicate of GABPA.


