
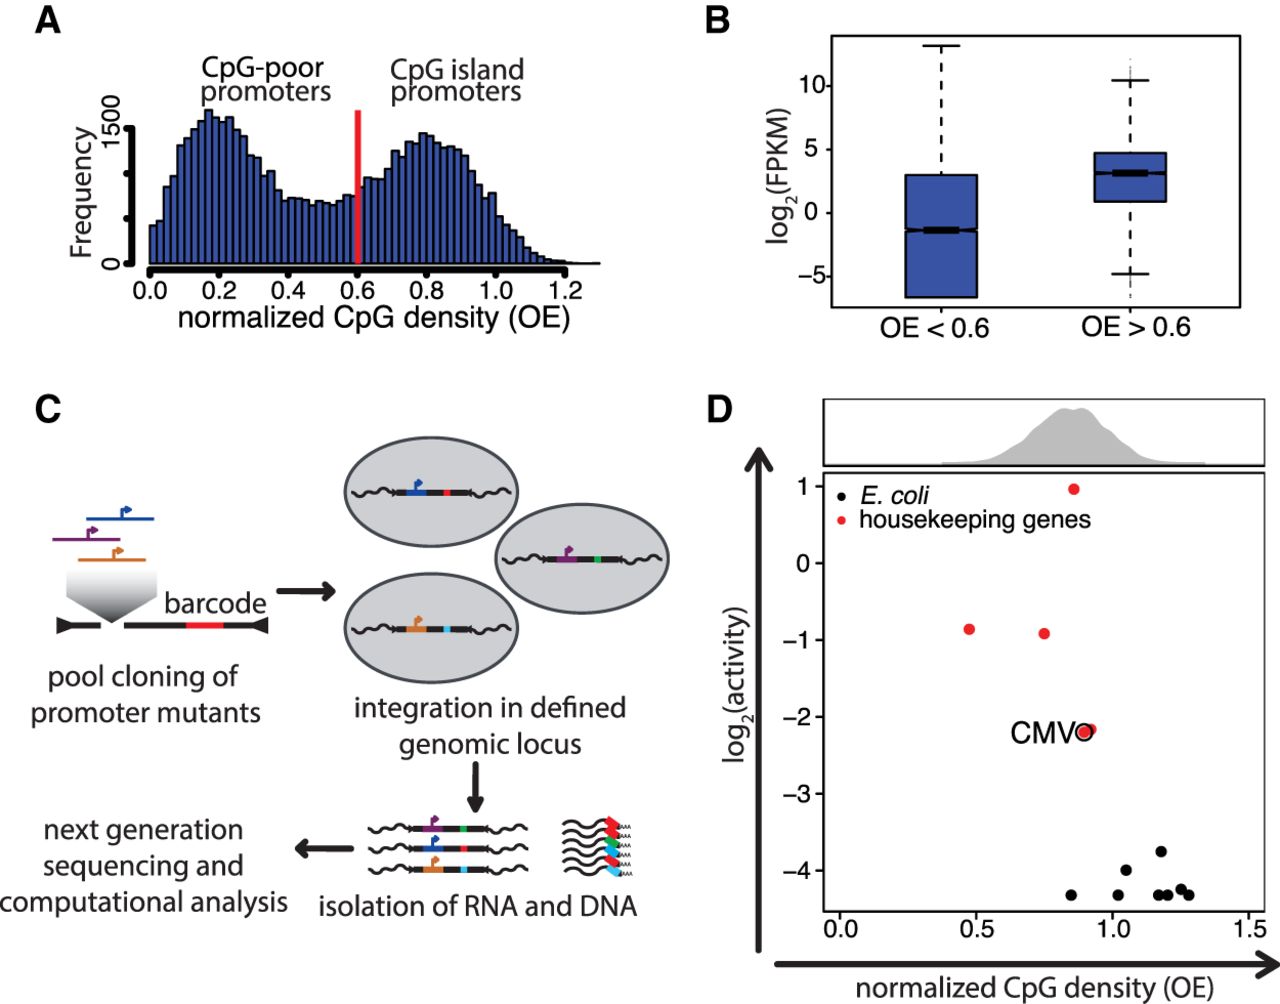
High normalized CpG density alone is not sufficient for transcriptional activity. (A) Histogram of CpG densities of all promoters in the mouse genome (400 bp upstream to 200 bp downstream from TSS). Normalized CpG density is distributed in a bimodal fashion. CpG density was calculated as the observed to expected ratio (OE = [number of CpGs/{number of Cs × number of Gs}] × length of the region in nucleotides). The red line indicates the threshold in OE used in the standard definition of CpG islands (Gardiner-Garden and Frommer 1987). (B) Box plot displaying transcriptional activity of CpG-poor (OE < 0.6) and CpG-rich (OE > 0.6) promoters, as measured by RNA sequencing in embryonic stem cells (data from Domcke et al. 2015). (FPKM) Fragments per kilobase per million mapped reads. (C) Schematic representation of the procedure used to perform parallel reporter assays in a defined genomic locus. Promoter mutants are batch-cloned in front of GFP as a spacer sequence and a unique barcode. The expression cassette is flanked by loxP sites that allow integration into the beta-globin locus of the embryonic stem cell line, replacing a selection cassette. After selection for cells containing the reporter construct, DNA and RNA are isolated and the latter reverse-transcribed. Barcodes are PCR-amplified and sequenced. Normalization of RNA barcode frequency to DNA barcode frequency results in relative expression levels between constructs. (D) CpG density versus transcriptional activity of sequences from the Escherichia coli genome (black dots) and active housekeeping genes (HKG, red dots) inserted into embryonic stem cells. The CMV promoter is indicated for reference as an example of a lowly active promoter. The histogram above the scatter plot depicts the normalized CpG density distribution of CGI promoters.


