
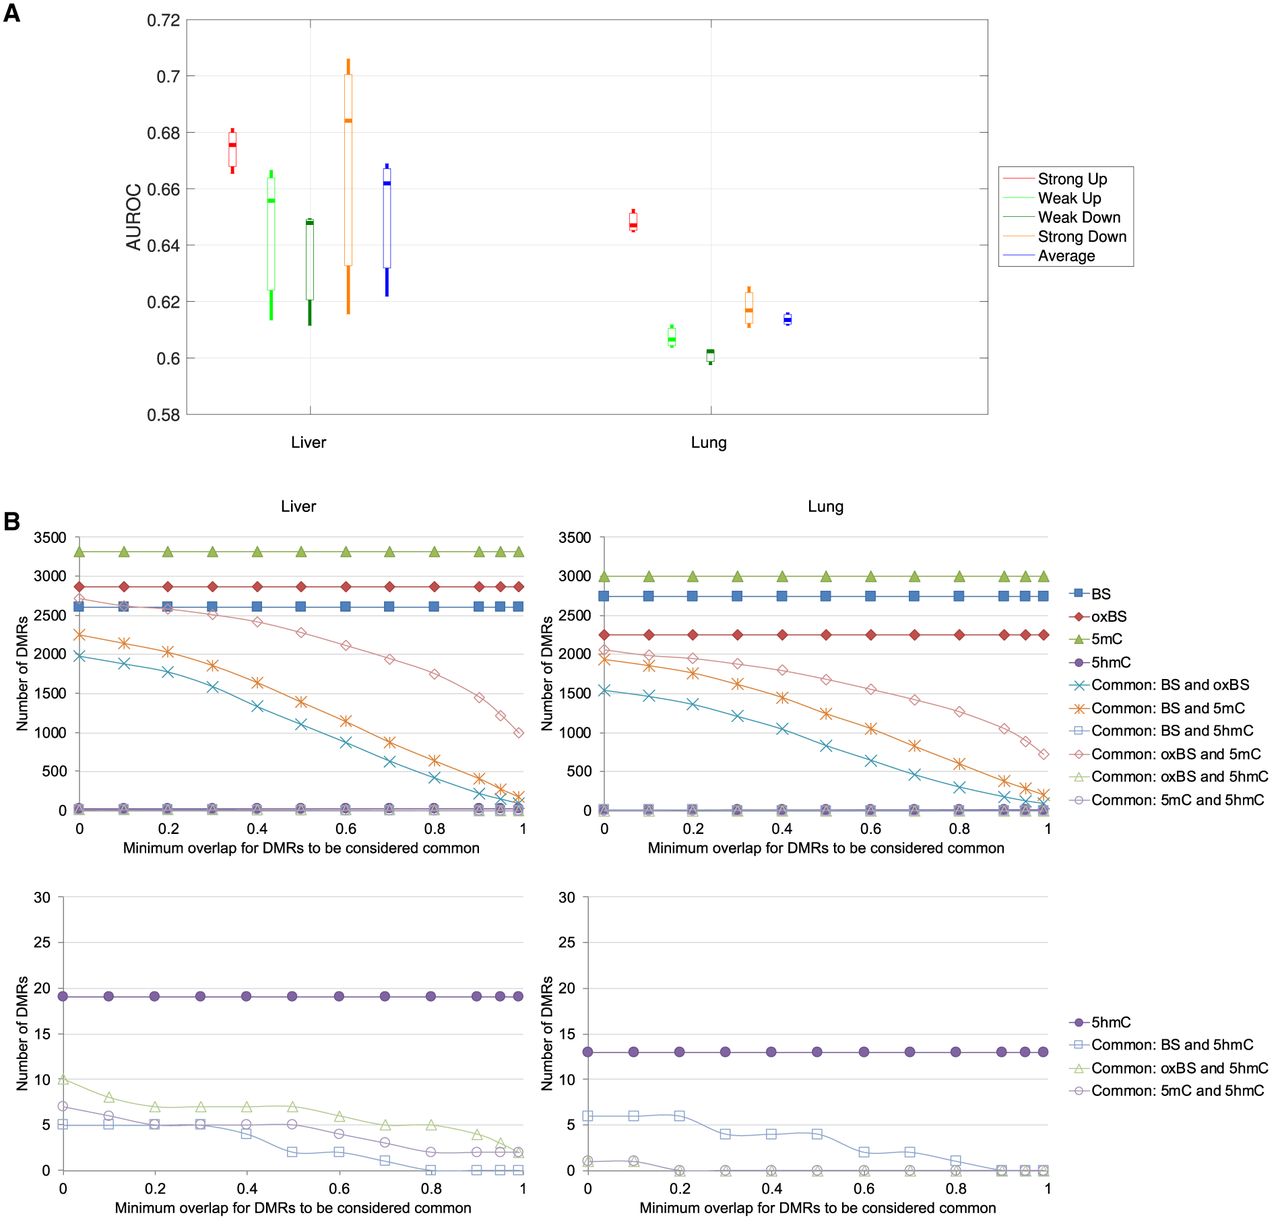
Figure 4.
Relationship between methylation and differential expression in cancer. (A) Accuracy of the models for inferring differential expression class, involving all β-value features, based on the large data set with an interclass gap percentage of 80%. Each bar represents the AUROC values of the three pairs of samples in the group. (B) Overlap of DMRs identified using only WGBS data, only oxWGBS data, only 5mC levels, or only 5hmC levels, for liver (left) and lung (right) samples using metilene. The lower plots are zoomed-in views of the bottom parts of the upper plots.


