
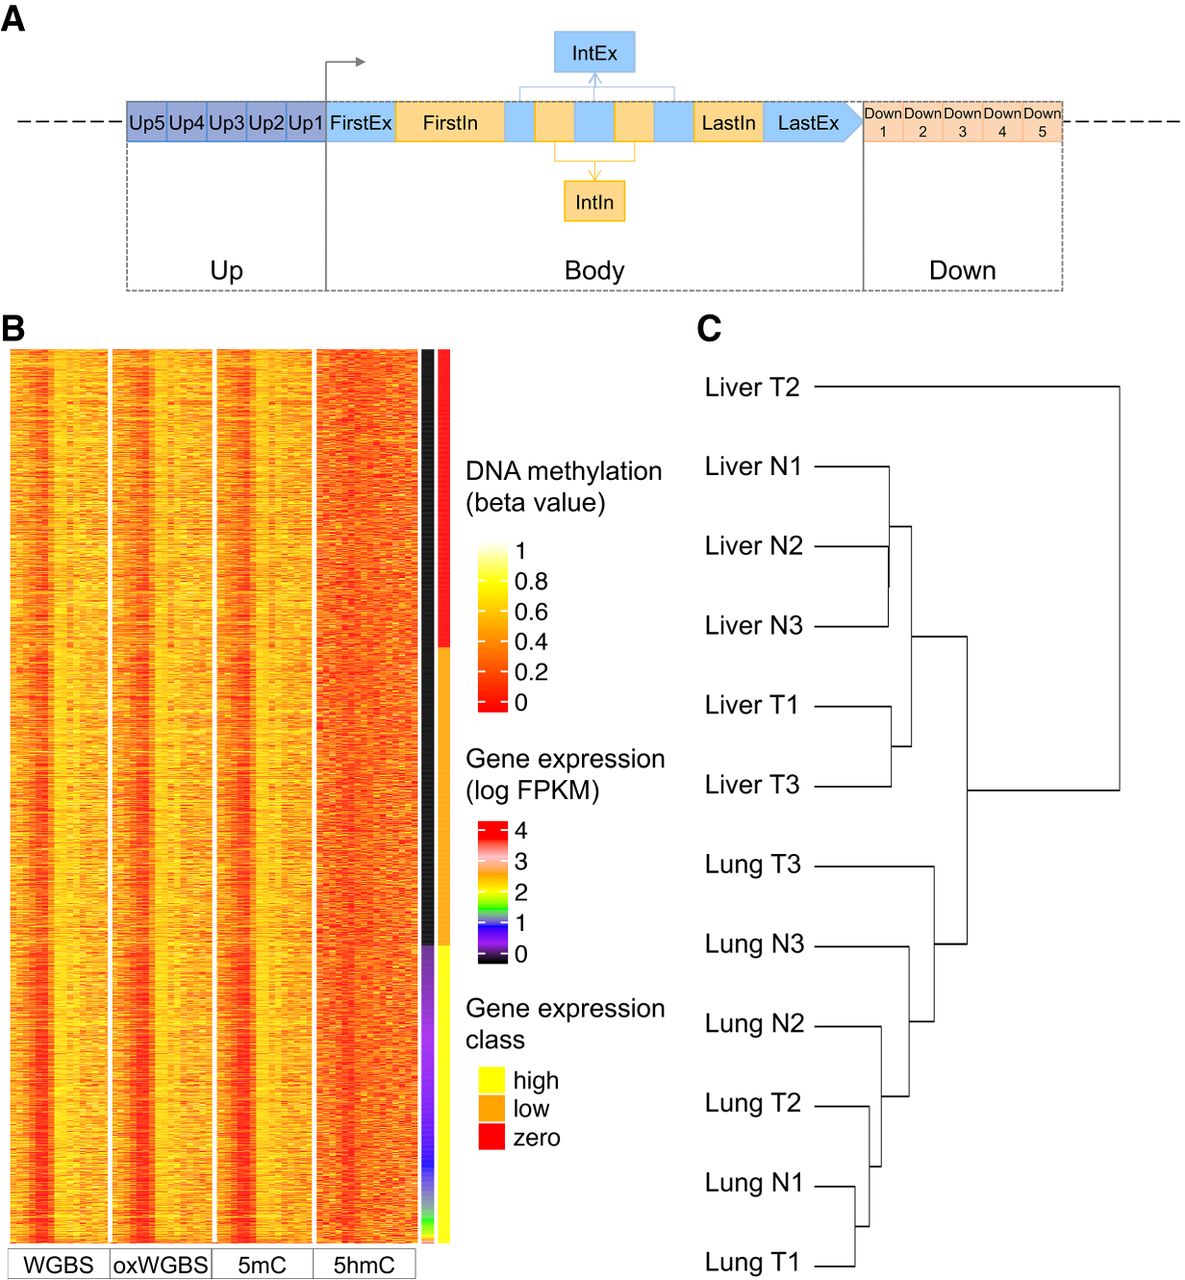
Definition of the regions associated with each transcript and the resulting data set. (A) Genomic regions defined for each transcript at which the β values or PDR values were used to infer expression level of the transcript. Both the upstream (Up) and downstream (Down) regions were divided into five 400-bp bins (Up1–Up5 and Down1–Down5). The transcript body (Body) was divided into first exon (FirstEx), first intron (FirstIn), internal exons (IntEx), internal introns (IntIn), last exon (LastEx), and last intron (LastIn). (B) A heat map of the resulting large data set for sample Liver T1. Each row represents a transcript, and the transcripts are sorted in ascending order according to their expression levels. The four blocks of columns represent β values based on WGBS, oxWGBS, 5mC, and 5hmC, respectively. Within each block, the different columns are, respectively, Up5–Up1, FirstEx, FirstIn, IntEx, IntIn, LastEx, LastIn, and Down1–Down5. After the four methylation blocks, the last two columns show the log expression level and expression class, respectively. (C) Hierarchical clustering of the samples based on all their methylation features in the large data set using Ward's method.


