
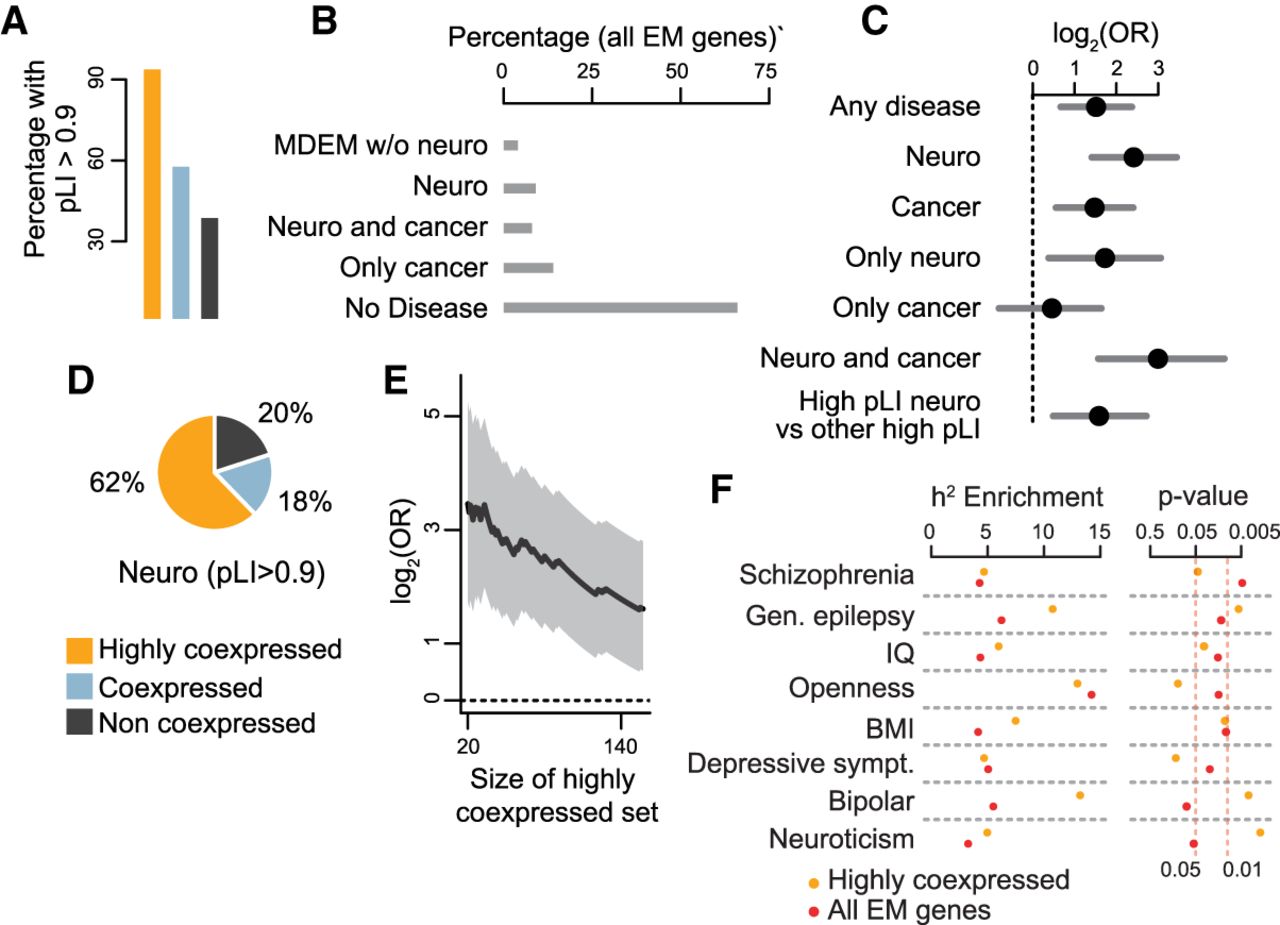
EM genes linked to disorders with neurological dysfunction demonstrate significant enrichment within the highly coexpressed category. (A) The percentage of EM genes with pLI > 0.9 in each of the coexpression categories. (B) The percentage of EM genes that are associated with different types of disease; individual disease categories are mutually exclusive. (MDEM) Mendelian disorders of the epigenetic machinery; (Neuro) includes autism, schizophrenia, developmental disorders, and MDEM whose phenotype includes dysfunction of the central nervous system (Methods). (C) Log odds ratios and 95% confidence intervals for enrichment of different subsets of EM genes in the highly coexpressed category. The dashed vertical line at 0 corresponds to statistical significance. (D) The percentage of EM genes that are associated with neurological dysfunction and have pLI > 0.9 in each of the coexpression categories. (E) Odds ratio (black line) and 95% confidence interval (shaded area) for enrichment of EM genes associated with neurological dysfunction in the highly coexpressed group, as a function of the size of the highly coexpressed group. For all sizes, the comparison was performed against the not coexpressed group. (F) Estimates for enrichment of explained heritability, and unadjusted P-values, for eight traits and two sets of regulatory features: regions marked by H3K27ac in brain within 1 Mb of the transcription start site of all-EM (red dots) or highly coexpressed (orange dots) EM genes.


