
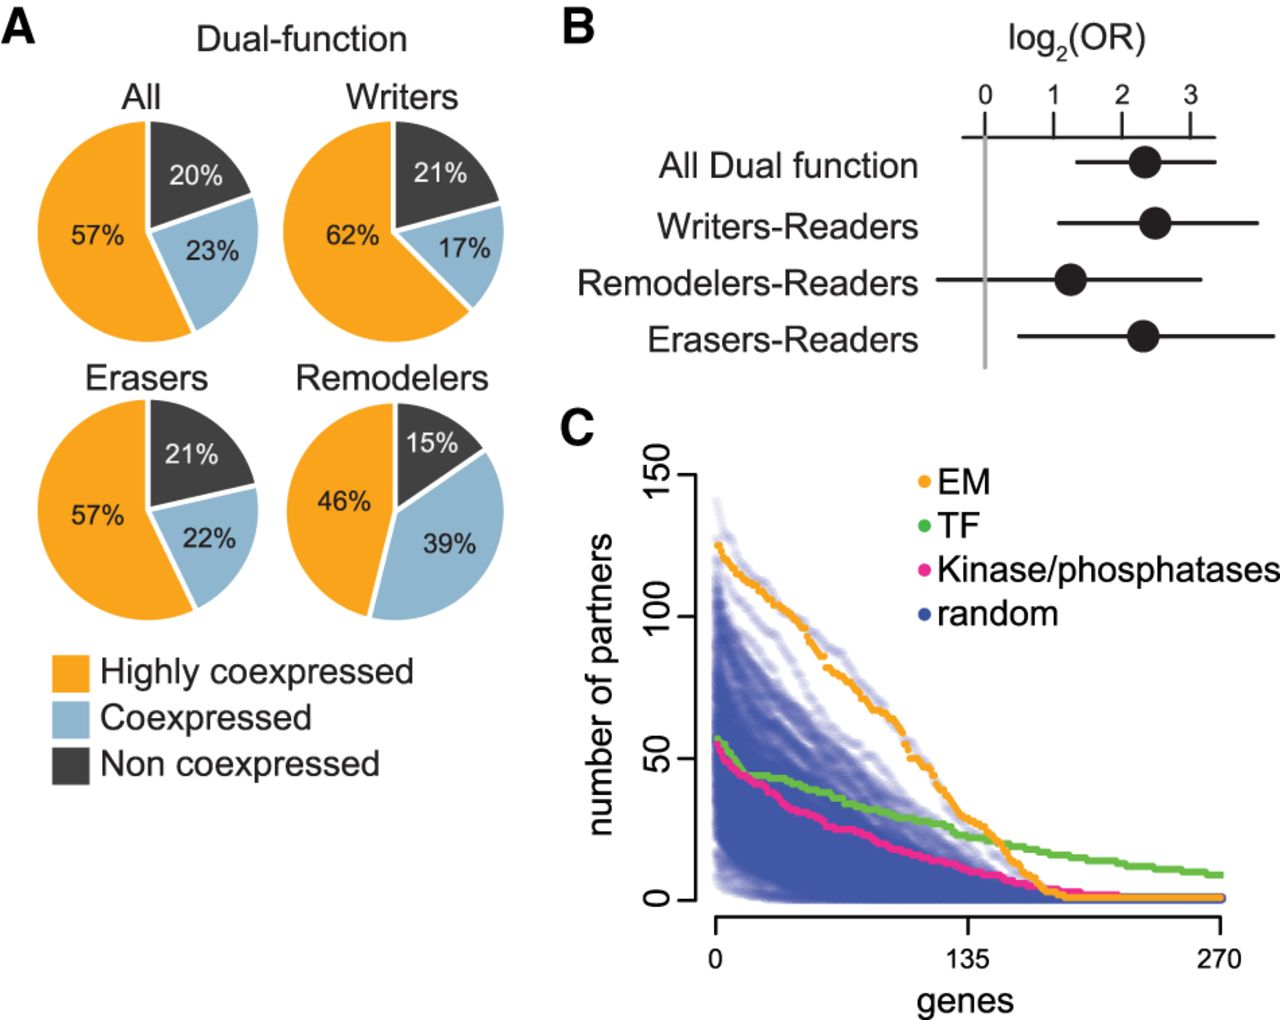
Dual-function EM genes are enriched within the highly coexpressed group. (A) The distribution of dual-function EM genes (collectively and separately for each enzymatic group) within the three coexpression categories. (B) Log odds ratios and 95% confidence intervals for enrichment of dual-function EM genes (collectively and separately for each enzymatic group) in the highly coexpressed category. The vertical gray line at 0 corresponds to statistical significance. (C) Blue dots correspond to randomly chosen genes, sampled in sets of 270 genes from genes with a median expression (log(RPKM + 1)) greater than 0.5 in at least half the tissues, to match the expression of EM genes (as in Fig. 4D). Orange, green, and pink dots correspond to EM genes, TF genes, and protein kinases/phosphatases, respectively. Each dot corresponds to a single gene, and its position along the y-axis corresponds to the number of other genes with which it partners. The genes are ordered on the x-axis according to the number of their partners. This figure also serves as a sensitivity analysis with respect to the number of partners for this particular tissue cutoff.


